Singapore bank depositors should consider moving up the risk capital structure of a bank by allocating a portion of their deposits in higher yielding fixed income securities. After all, depositors inherently share the credit risk of a bank. History tells us that depositors can lose their savings in the event of a bank failure.
With that in mind, recent developments suggest that depositors may be more incentivised to invest elsewhere. Firstly, the Singapore Deposit Insurance Scheme only guarantees up to S$75,000 in Singapore dollar deposits. Secondly, banks could reduce their deposit rates further. DBS has announced that with effect from 1 Jan 21, interest rates on the DBS Multiplier Account will be lower in all categories. This year, OCBC also reduced the interest rates on their 360 Account, citing the downward trend in the broader interest rate market.
While Singapore bank bonds may not be comparable to deposits, we think that they are a viable alternative for investors who want to seek higher yield yet gain exposure to the lenders. To explain on this proposition, we believe that there is a very remote possibility of a bank resolution at this point so individuals who want to keep savings in a bank will receive a higher return if they allocate their excess capital towards the other parts of the bank’s capital structure. Furthermore, they would receive the same economic exposure to the lender had they kept their funds in deposits.
Banks are profitable
Bond issuers have retained a high solvency profile in spite of recent weakness at the top-line. Lenders witnessed a drop in total income on a year-on-year basis in the recent quarter ended 30 Sep 20 (“3Q20”). Total income for UOB, OCBC and DBS decreased 13.4%, 4.4% and 6.4% YoY respectively and this was mostly because of lower net interest incomes.
A benign outlook for interest rates will weigh on net interest income looking ahead. But stronger wealth management inflows and higher capital market activity should provide some lift to non-interest income in the short term. As a matter of fact, 3Q20 non-interest incomes at OCBC (up 6.0% YoY) and DBS (up 3.2% YoY) have already improved from 3Q19.
Table 1: Total income and year-on-year change
|
|
UOB |
OCBC |
DBS |
|
3Q20 Net interest income (S$ m) |
1,474 |
1,421 |
2,171 |
|
3Q20 Non-interest income (S$ m) |
786 |
1,118 |
1,406 |
|
3Q20 Total income (S$ m) |
2,260 |
2,539 |
3,577 |
|
Net interest income YoY change (%) |
-12.6% |
-11.2% |
-11.7% |
|
Non-interest income YoY change (%) |
-14.8% |
6.0% |
3.2% |
|
Total income YoY change (%) |
-13.4% |
-4.4% |
-6.4% |
| Source: Company filings, 30 Sep 20. | |||
Operating profit before credit allowances for all 3 banks were lower from 3Q19, reaching close to the level in 3Q17 (Table 2). As a result of the weak economic outlook, credit allowances were likewise significantly higher than 3Q19. After accounting for these provisions, the banks made profits of between S$668m and S$1,297m.
With respect to loan loss provisions, DBS guided that credit allowances will approximate S$3 billion to S$5 billion over these two years, although the lender had booked S$2.49 billion of credit-related charges in the first nine months of 2020. Amidst a flurry of recent Chinese SOE defaults, DBS was reportedly listed as one of the creditors to the financially distressed Huachen Automotive Group with a RMB779 m (~S$160m) of exposure.
This may pressure profitability in the short term. We also suspect that DBS will take a hit from the amalgamation of the two entities – Lakshmi Vilas Bank (“LVB”) and DBS Bank India Limited (“DBIL”) – that came into effect from 27 Nov 20. After obtaining approval from the Reserve Bank of India, DBIL will take over LVB’s INR 209.74 billion (S$3.9 billion) of deposits and INR 135.05 billion (S$2.5 billion) of net advances. DBS will provide INR 25 billion (S$463m) to DBIL to help extend its banking presence to over 563 branches in South India.
Table 2: Operating and net profit
|
|
UOB |
OCBC |
DBS |
|
3Q20 Operating profit (S$ m) |
1,252 |
1,441 |
2,038 |
|
3Q19 Operating profit (S$ m) |
1,455 |
1,523 |
2,209 |
|
3Q17 Operating profit (S$ m) |
1,265 |
1,359 |
1,781 |
|
3Q20 Credit allowances and other losses (S$ m) |
477 |
350 |
554 |
|
3Q19 Credit allowances and other losses (S$ m) |
145 |
323 |
254 |
|
3Q20 Net profit after tax (S$ m) |
668 |
1,028 |
1,297 |
|
3Q19 Net profit after tax (S$ m) |
1,118 |
1,172 |
1,629 |
| Source: Company filings, 30 Sep 20 | |||
Asset coverage has improved
During the third quarter, DBS disclosed that loan moratoriums for corporate loans increased to S$13.5 billion (an equivalent 3.6% of loan book) while moratoriums for consumers stayed around S$5.7 billion (1.5% of loan book). However, most of these loans are secured by property and the collateral loan-to-value ratios for consumer loans were generally below 70%. Total allowances over non-performing assets (“NPA”) increased from 96% in 3Q19 to 107% in 3Q20.
OCBC’s NPA coverage ratio also improved from 78% to 109%. With respect to the update for the various loan relief programs, OCBC disclosed that the percentage of loans under relief dropped from 10% in July to ~5% at the end of October. Malaysia’s loan repayment moratorium ended in September and S$1.0 billion of the country’s loans have asked the lender for other payment options.
According to UOB, its percentage of loans under moratorium contracted from ~16% in July to ~10% in October. But the proportion of loans under moratorium is likely to be high as many borrowers in the various Southeast Asian regions have sought assistance to defer payments into 2021. Asset quality however is manageable as nearly 90% of these loans is secured by collateral or backed by government guarantees. Similar to the other banks, NPA coverage ratio for UOB grew from 85% in 3Q19 to 111% in 3Q20.
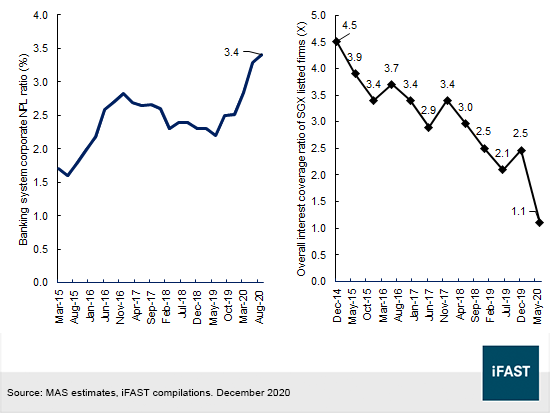
Figure 1: Corporate NPL ratio and interest coverage ratio
NPLs have risen but interest coverage is manageable
Even as provisioning coverage has improved, non-performing loans (“NPL”) for corporates have been on the rise, reaching 3.4% as at September 2020 (Figure 1). The ratio may have soared above 3.4% had it not been for the support from the Jobs Support Scheme (JSS) and loan relief measures provided to SMEs during the recent downturn. However, the 0.9 percentage point (“ppt”) gain between September 2020 and September 2019 is lower than the 1.0 ppt gain between June 2015 and June 2016, suggesting that the pace of incline is less pronounced than in 2015.
To expound on the loan relief measures for SMEs, the government helped to share the risk on certain SME loans and launched a lending facility to support financial institutions in extending credit to small companies. Total bank lending for SMEs consequently increased 4.9% during the circuit breaker period from S$86.2 trillion in December 2019 to S$90.4 trillion in June 2020.
The debt servicing ability of Singapore firms would be a good indicator of asset quality as most of the banks have a substantial loan exposure in Singapore. Referring to MAS estimates in Figure 1, the interest coverage ratio of SGX-listed firms have declined over the years, reaching 1.1x as of June 2020. Despite being in a downward trend, a ratio above 1 is a manageable level and will likely improve after June as we have seen a rebound in the economy during the third quarter.
Banks have high capital buffers
Common equity tier 1 or CET 1 ratios for DBS / OCBC / UOB were 13.9% / 14.4% / 14.0% at the end of September, all above the regulatory minimum thresholds. Liquidity coverage ratios were also more than 100%, implying that the banks have a sufficient level of high quality liquid assets to survive a significant 30-day stress scenario.
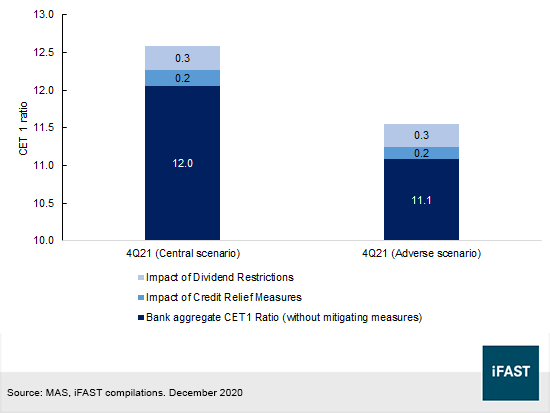
Furthermore, MAS stress test results in December indicated that the CET1 measures will remain above regulatory requirements under the Central and Adverse scenarios. In the Central scenario, Singapore’s GDP contracts in 2020 but stages an uneven recovery in 2021, recovering to pre Covid-19 levels in 2H21. Unemployment peaks in 3Q20, but stays at an elevated level until next year.
In the Adverse scenario, disruptions in the deployment of the vaccine results in a sharp decline in 2020 GDP with a recovery back to pre-crisis 4Q19 level beyond 2021. Unemployment increases significantly and will peak only in the middle of 2021.
Projected aggregate CET 1 ratio for the three banks would be 12.6% and 11.5% under both scenarios and would be 0.5 percentage points lower had it not been for the credit relief measures (i.e. debt moratoriums by financial institutions and risk sharing by the government in the issuance of loans), as well as dividend caps. These dividend restrictions are credit positive for the banks and will improve CET 1 ratio by 0.3 ppt according to MAS.
Figure 2: Aggregate CET 1 impact under the stress scenarios
Our recommendations
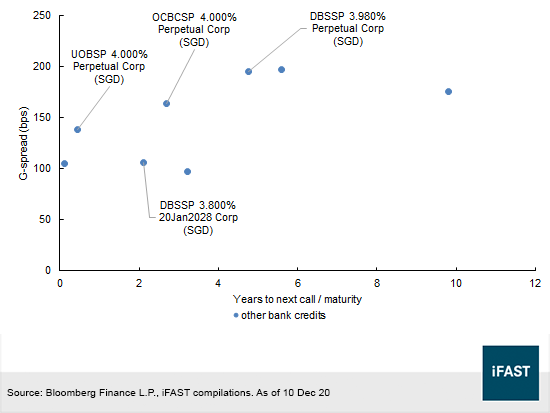
After reviewing the aforementioned factors, we think that certain perpetual notes along the local bank curves are attractively priced. Within the SGD space, investors may consider the OCBCSP 4.000% Perpetual Corp (SGD), and DBSSP 3.980% Perpetual Corp (SGD), at their G-spreads of 164 bps and 195bps respectively (Figure 3). The perps provide the highest yields among other comparable credits. As of 20 Dec 20, the OCBC 4% perp and DBS 3.98% perp have an indicative yields to next call of 1.81% and 2.41% (Table 3).
Table 3: SGD perpetual notes
|
|
Indicative yield to next call (%) |
Regulatory treatment |
First call date |
Coupon rate |
Write down feature |
|
OCBCSP 4.000% Perpetual Corp (SGD) |
1.81 |
Additional Tier 1 |
24 Aug 23 |
4.0% p.a. up to 24 Aug 23. If not redeemed, prevailing 5-year SGD SOR plus 1.811% p.a. , resets every 5 years |
Yes |
|
DBSSP 3.980% Perpetual Corp (SGD) |
2.41 |
Additional Tier 1 |
12 Sep 25 |
3.98% p.a. up to 12 Sep 2025. If not redeemed, 7Y SGD Swap Rate plus 1.65% p.a. thereafter, resets every 7 years |
Yes |
| Source: Bloomberg Finance L.P., Company filings, iFAST compilations. As of 10 Dec 20 | |||||
Figure 3: SGD bank notes
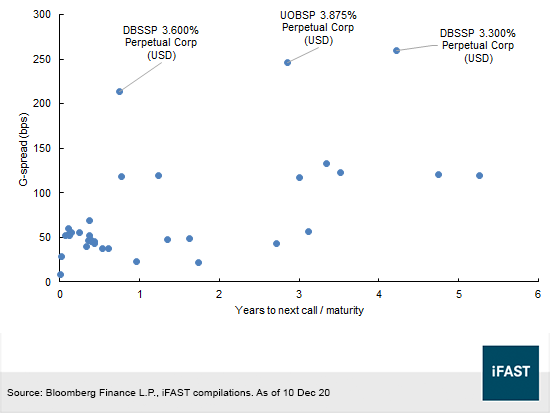
Comparing the bank’s US dollar notes, we think that the DBSSP 3.600% Perpetual Corp (USD), UOBSP 3.875% Perpetual Corp (USD) and DBSSP 3.300% Perpetual Corp (USD) are attractively priced given their G-spreads of 214bps, 246bps and 260bps respectively (Figure 4).
Figure 4: US dollar denominated bonds
In our relative value analysis, we do not hold any of the Singapore banks in a higher position with respect to the other because we think there is little difference between the lenders’ credit profiles at this juncture. So taking this into consideration, we are comfortable recommending either of the banks’ perpetual securities and would simply factor in their call dates and credit spreads as a basis of recommendation, notwithstanding the fact that the banks already have high investment grade issuer ratings by the credit rating agencies.
Declaration:
For specific disclosure, at the time of publication of this report, IFPL (via its connected and associated entities) has a principal position in DBSSP 3.600% Perpetual Corp (USD). The analyst who produced this report holds a NIL position in the abovementioned securities.
Our podcast series, Yield Hunters, is available on Spotify and iTunes Podcasts and Google Podcasts. We share our thoughts on new bond issues and hold discussions on the fixed income space. Listen to our latest episode below and follow us!