Company background
Metro Holdings Limited (“Metro”; Bloomberg Ticker: Metro:SP) is probably better known among Singaporeans for its departmental stores in the city-state. The company has its history dating back to 1957, when founder Mr Ong Tjoe Kim started the company as a textile store.
Metro was listed on SGX-ST in 1973, and sported a market cap of ~S$611.2m at yesterday’s close. Today, the Ong family remains as a substantial shareholder of the company, controlling around 35.4% of its shares (as at 13 Jun 19). Other than the founding family, Takashimaya Company Limited is also a key shareholder, owning 10.3% of the group.
Over the years, Metro has evolved from a departmental store operator to a property investment and development group. As at 31 Mar 20, investment properties, associates, joint ventures and development properties comprised of 63% of its total assets.
FY20 results: shift to property continues
In the year ended 31 Mar 20 (“FY20”), Metro recorded a revenue of S$210.3m, up 22.3% YoY, mainly lifted by increased sale of property rights to S$95.2m, up from S$34.5m in the previous year. This was partially offset by lower rental revenue from GIE Tower, which fell 10.1% YoY to S$6.2m, as rental rebates were extended to tenants in the last quarter of the financial year due to COVID-19. Metro’s retail revenue also fell 16.6% YoY to S$108.9m due to the closure of Metro Centrepoint in October upon lease expiry, as well as shortened operating hours of its departmental stores in February and March.
Metro continued to focus on expanding its property business and the shift away from retail operations. In FY20, the group closed its Metro Centrepoint store in Singapore, leaving only two stores in operation, namely Metro Paragon and Metro Woodlands. It also divested its Indonesian retail business in December, retaining a trademark for licensing fee.
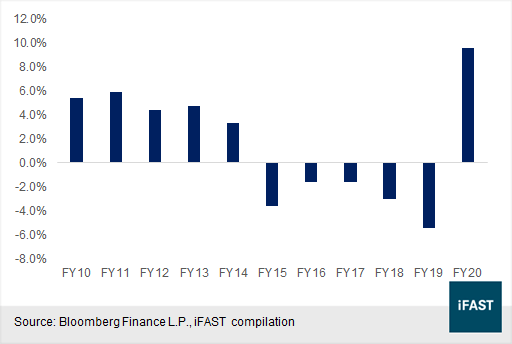
Metro’s rationalisation of its retail business appeared to have produced fruitful results, as the retail segment’s profit margin improved significantly after years of lacklustre results (see Figure 1). However, the current pandemic situation will likely hamper its retail business in the near term.
Figure 1: Metro’s retail operating margins
Meanwhile, Metro acquired a 50% stake in 7&9 Tampines Grande, 25% stake in The Atrium Mall in Chengdu, China, and 20% stake in a portfolio of 14 office and retail properties across Australia. The group’s portfolio of retail and commercial properties across various countries are listed in Table 1 below.
Table 1: Metro’s property portfolio as at 31 Mar 20
|
Property |
Property description |
% owned by Metro |
Tenure |
Occupancy rate |
Valuation (S$m)* |
|
GIE Tower |
Office tower with a shopping podium, located in Guangzhou, China. |
100 |
50-year term from 1994 |
93.8 |
109.0 |
|
Metro City |
9-storey retail/entertainment centre situated at Shanghai, China |
60 |
36-year term from 1993 |
94.8 |
113.8 |
|
Metro Tower |
26-storey Office Tower situated at Shanghai, China |
60 |
50-year term from 1993 |
94.3 |
136.8 |
|
5 Chancery Lane |
8-storey office building located at London, UK |
50 |
Freehold |
100 |
70.2 |
|
7 & 9 Tampines Grande |
Two blocks of 8-storey office tower with retail units and carparks, located at Singapore |
50 |
99-year term from 2007 |
88.6 |
202.5 |
|
Bay Valley |
Office buildings in Shanghai, China |
30 |
50-year term from 2008 |
Fully leased |
60.9 |
|
Shanghai Plaza |
Retail mall in Shanghai, China |
35 |
50-year term from 1992 |
Under asset enhancement |
216.3 |
|
The Atrium Mall |
Retail mall in Chengdu, China |
25 |
40-year term from 2007 |
Under asset enhancement |
RMB200 |
|
Australia portfolio |
Portfolio properties comprising of 4 office buildings and 10 retail centres. Span across 4 key states in Australia, namely New South Wales, Victoria, Queensland and Western Australia |
20 |
Freehold |
Average occupancy rate: 96.7 |
152.0 |
|
*Valuation figures are based on Metro’s ownership stake. Note: Except GIE Towers, which is wholly owned, properties are held at JVs and associates. Source: Company filings |
|||||
As seen in Table 1, most of its properties recorded decent occupancy rates of above 90%, although we note that occupancy has fallen from the prior year (except for Chancery Lane, which remained fully occupied). We also observed that most of Metro’s China properties had a remaining leasehold term of less than 30 years. Our guess is that potential obsolescence in Metro’s properties may post challenges to achieving higher rental rates and occupancies. Metro may incur higher capital expenditures on maintenance, asset enhancements or fees for land rights extension on these properties in the longer term.
Metro’s property division was adversely impacted by the COVID-19 situation in FY20. During the year, the company recorded a fair value loss of S$2.5m on GIE Tower, compared to S$14.7m of fair value gain in FY19. It also recorded share of losses from associates of S$29.0m, against share of profits of S$13.8m in the previous year, as rental rebates were given to tenants to cushion the impact from COVID-19.
Meanwhile, the share of profit from joint ventures decreased by S$9.3m to S$55.9m in FY20, mainly due to lower fair value gain on investment properties owned by joint ventures. On the other hand, we noted that even after rental rebates and waivers, some of the investment properties held through joint ventures, including Metro City and Metro Tower in Shanghai, achieved higher profit contributions during the period.
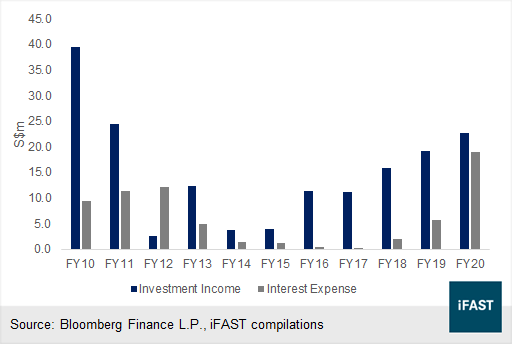
Overall, profit before tax fell to S$39.7m (FY19: S$108.0m) mainly due to share of losses from associates. Finance expenses climbed from S$5.8m in FY19 to S$19.0m in FY20, comprising mostly of coupon payments on S$350m of outstanding bonds. We estimated earnings before interests and taxes of S$58.7m (FY19: S$113.8m), which covered 3.1 times of interest expenses, a manageable level in our view.
Other than investing in properties via joint ventures and associates, Metro is also a passive real estate investor through its stakes in property funds. During the year, the company recorded other net income of S$36.1m (FY19: S$33.9m), of which S$22.7m was interest income and S$6.2m was dividends. These investment incomes have become an increasingly important source of earnings and regularly exceeded interest expenses (see Figure 2).
Figure 2: Metro’s investment income relative to interest expense
Healthy balance sheet
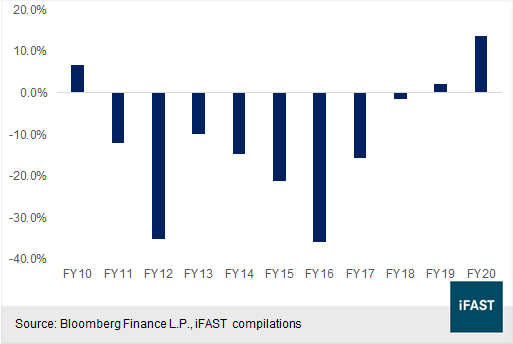
As at 31 Mar 20, Metro carried a total debt load of S$493.5m, up from S$229.7m, due to loans drawn to fund the investment in office and retail properties in Australia. As such, net gearing (net debt over equity) rose to 9.4% as at 31 Mar 20, up from 2.2% a year ago. The current level of net gearing is healthy in our opinion, although we think Metro may incur more debt going forward as it expands its exposure to the capital-intensive property industry.
Nonetheless, Metro appears to have a prudent financial philosophy, as demonstrated by a track record of low net gearing over the years, depicted in Figure 3 below. Hence, we think management would make an effort to strike a balance between keeping a healthy balance sheet and their expansion into the property sector.
Figure 3: Metro’s net gearing
With its roots in department store operations, Metro’s approach to the real estate business appears to be conservative. Unlike a typical property developer, Metro’s real estate undertakings often involve partnering with established players in the property business.
As at 31 Mar 19, Metro had S$2.6m of capital commitments in capital expenditure, S$46.4m of financial support given to subsidiaries, and S$57.1m of corporate guarantees provided to banks for loans taken by its subsidiaries. Treating these amounts as liabilities of Metro, we find adjusted net gearing at 16.4%, still a manageable level in our opinion. Moreover, we noted that the amount of financial support had been reducing gradually (31 Mar 17: S$128.1m; 31 Mar 18: S$89.9m). Similarly, the amount of corporate guarantees provided on subsidiary loans had come down from S$65.9m and S$136.8m in FY17 and FY18 respectively.
Metro’s refinancing risk is low in our view as short-term debt obligations of S$145.2m are well covered by S$349.4m of cash. In a response to SGX’s queries on its FY20 results, Metro disclosed that short-term debt as at 31 Mar 20 pertains to revolving credit facilities, which the group has been able to roll over regularly and intends to continue to do so. All of Metro’s debt as of end-March was unsecured borrowings, which should provide the company the flexibility to raise secured debt if need be.
As at 31 Mar 20, Metro carried S$109.0m of investment properties (GIE Tower in Guangzhou) and S$166.7m of development properties, which comprised of two residential projects in Indonesia. The bulk of its properties assets are held through stakes in associates and joint ventures. These include S$795.6m of interests held in associates, which, among others, represent ownership in Bay Valley and Shanghai Plaza in Shanghai, The Atrium Mall in Chengdu, and the Australia property portfolio. The company also carries S$337.3m of investments in joint ventures, which own Metro City and Metro Tower in Shanghai, 5 Chancery Lane in London, and 7&9 Tampines Grande in Singapore.
Metro’s debt-to-assets ratio is manageable at 22.1% (4QFY19: 12.1%). Long-term debt obligations of S$348.3m comprised of the S$150m METRO 4.000% 25Oct2021 Corp (SGD) and S$200m METRO 4.300% 02Apr2024 Corp (SGD).
Decent fundamentals to withstand pandemic headwinds
Following the downsizing of its retail operations, we expect Metro’s future earnings to comprise of primarily recurring income sources, or rentals from its portfolio of properties. Broadly speaking, we expect Metro’s results in the upcoming quarters to stay weak, in view of the ongoing pandemic situation, albeit stabilizing at a low point. In particular, Metro’s property division is likely to experience varying degrees of recovery as the group invests in properties widely across countries such as China, Singapore, Indonesia, Australia, and the UK. These countries are in different phases of the COVID-19 trajectory, and have varying levels of success in terms of their efforts to contain the virus.
In China, where the lion’s share of its properties by valuation is located (see Table 1), authorities appear to be better able at containing the healthcare crisis. According to a market research report on office buildings in Shanghai published by Savills in July, citywide Grade A office rents fell 4.0% in 2Q20, but vacancy rate rose by just 0.5 percentage points (“ppt”) to 17.4%. Furthermore, despite a 6.7% contraction in rental rates during 1Q20, the city witnessed a rebound in economic activities in 2Q20, which in tandem with fiscal support should lead to stronger tenant demand.
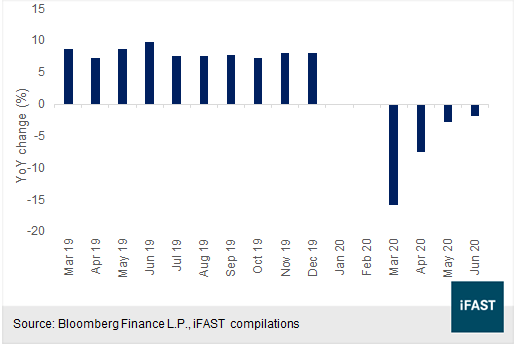
However, the outlook on Shanghai’s rentals for retail properties are relatively less optimistic. According to a July report by, overall shopping mall vacancy rates climbed by 3.1 ppt to 11.6% in 2Q20, the highest level since 3Q15. Interestingly, Savills noted that luxury retail operators experienced a faster recovery within the overall retail market, an indication that Chinese consumers continued to hold high purchasing power. In addition, retail sales have shown signs of bottoming in recent months as China’s pandemic situation stabilises (see Figure 4).
Figure 4: China’s retail sales
Metro’s property pipeline comprises of two residential projects, namely Trans Park Juanda and Trans Park Bintaro, both located in Jakarta, Indonesia. The two projects have a gross development value of IDR 1.99 trillion and IDR 1.33 trillion respectively, with Metro owning a 90% stake in each project. While the company has not disclosed the percentage sold figures for these projects, they should be nearing completion with a target completion date of mid-2021.
The spread of COVID-19 has shown no signs of a slowdown in Indonesia thus far (see article “First REIT: Credit Update 30 Jul 20”). Therefore, we think Indonesia’s residential property market is likely to stay challenged in view of restricted movements and activities, and sales of Metro’s residential projects in the country to slow down.
That being said, we think Metro’s decent liquidity position should help the company tide through near-term headwinds, given its large cash balance of S$349.4m relative to total current liabilities of S$208.6m. The company’s current ratio (current assets over current liabilities) of 4.0x (4QFY19: 4.2x) also suggests solid liquidity.
Furthermore, Metro’s healthy credit metrics should help to support the group through to the subsequent recovery phases. As at 31 Mar 20, Metro has a manageable debt-to-assets ratio of 22.1% (FY19: 12.1%), suggesting ample debt headroom above the secured debt-to-assets limit of 60% stipulated in its bond documentation.
Recommendation
In summary, we like that Metro has a decent credit profile underpinned by strong liquidity, unencumbered balance sheet, and healthy credit metrics. On the flipside, we are wary of rising leverage ahead as the group expands it property business, as well as near-term disruptions from the pandemic situation.
On the whole, we think yields on Metro’s bonds provide a good reward for downside risks related to pandemic developments. Metro has two bonds, namely the S$150m METRO 4.000% 25Oct2021 Corp (SGD) and S$200m METRO 4.300% 02Apr2024 Corp (SGD). At the indicative ask prices of 100.19 and 99.13, they carry ask yields to maturity (“YTM”) of 2.98% and 4.56% respectively.
The METRO 4% ‘21s yield 2.98% for about 1.3 years to maturity, offering a spread of 273 bps above SGD swap offer rates. The longer dated METRO 4.30% ’’24s are fairly priced as they offer a decent yield premium of 158 bps for about 2.4 years longer in tenure.
In the SGD bond market, we think a good comparable credit to Metro is Singapore Press Holdings (“SPH”) given their similar business profile. As at 29 Feb 20, SPH has a total asset size of S$8.6 billion, of which 75.1% are investment properties. SPH has a net gearing of 48% and similar to Metro, SPH is shifting its focus to property investments, with a portfolio of properties comprising mainly retail malls and student accommodations, while its media business continues to struggle.
SPH’s bonds reasonably have tighter spreads than Metro due to its much larger operating scale as Singapore’s largest print and media company. Nonetheless, we think Metro’s bonds offer better value. As a reference, SPH’s 3.2% ‘30s have an ask YTM of 3.34% and a remaining tenure of 9.5 years.
When comparing to other mid-sized property developers or real estate investment trusts that primarily invest in office, retail or hospitality properties (see Table 2), Metro’s notes are also a better choice. For instance, Wing Tai Holdings Limited’s (“WTH”) WINGTA 4% ‘21s and WINGTA 4.7% ‘24s have ask YTMs of 1.62% and 4.06% respectively. Similar to Metro, WTH also derives its revenue from property development, property investments and retail.
Table 2: Relative valuation
|
Issuer Ticker |
Coupon rate (%) |
Maturity date |
Ask price |
Ask YTM (%) |
Z-spread (ask; bps) |
Net debt over equity* |
|
WINGTA |
4.000 |
7-Oct-21 |
102.70 |
1.62 |
137 |
0.13x |
|
OUECT |
3.030 |
5-Sep-20 |
100.05 |
2.16 |
204 |
0.67x |
|
METRO |
4.000 |
25-Oct-21 |
101.19 |
2.98 |
273 |
0.09x |
|
SPHSP |
3.200 |
22-Jan-30 |
98.87 |
3.34 |
260 |
0.48x |
|
WINGTA |
4.250 |
15-Mar-23 |
101.42 |
3.67 |
335 |
0.13x |
|
WINGTA |
4.500 |
26-Sep-22 |
102.57 |
3.23 |
294 |
0.13x |
|
OUECT |
4.000 |
24-Jun-25 |
100.71 |
3.84 |
337 |
0.67x |
|
WINGTA |
4.700 |
28-Feb-24 |
102.10 |
4.06 |
367 |
0.13x |
|
METRO |
4.300 |
2-Apr-24 |
99.13 |
4.56 |
417 |
0.09x |
|
FRAG |
6.125 |
26-Apr-21 |
98.25 |
8.73 |
850 |
1.17x |
|
FRAG |
4.750 |
23-Nov-21 |
93.72 |
10.09 |
983 |
1.17x |
|
*Based on latest available financial results. Source: Bloomberg Finance L.P., iFAST compilations, pricing data are indicative only as at 11 Aug 20 |
||||||
Declaration:
For specific disclosure, at the time of publication of this report, IFPL (via its connected and associated entities) holds a principal position in the METRO 4.000% 25Oct2021 Corp (SGD). The analyst who produced this report hold a NIL position in the abovementioned securities.