The pace and extent of changes in market perceptions of the future outlook of global businesses can be fascinating to observe at times, if they are not occurring during this somber period when close to two million people are confirmed to have contracted the coronavirus. Late last year when we published our latest compilation of recommended bonds, we sounded a word of caution about the combination of strong financial market performance—likely stimulated by global monetary easing—and elevated geopolitical uncertainty in 2019.
Fast forward four months later, investor sentiment seems to have swung from cheerful to (near) hopeless. As the coronavirus continues to gain ground in Singapore and elsewhere, governments have deployed containment and lockdown measures that are likely to put the global economy into a severe contraction. The mandated cessation of business activity is the economic equivalent of a medically induced coma to facilitate the treatment of a patient, and the monetary and fiscal stimulus packages provided are akin to life support for the patient.
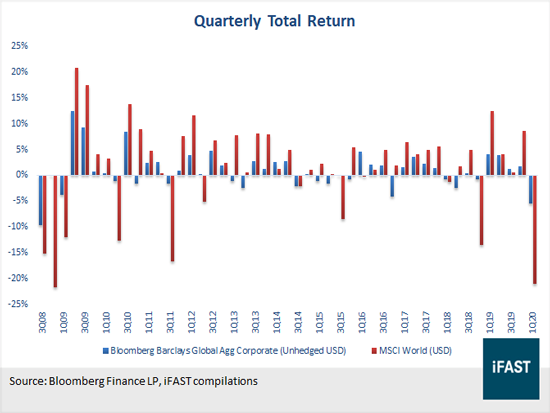
But prices of financial assets have plunged in response to the dire outlook, as investors fled from stocks and corporate bonds to cash and Treasuries. In the first quarter of this year, global equities and corporate bonds saw their worst quarterly performance since the global financial crisis (“GFC”) in 2008 (see Figure 1). For someone trying to invest intelligently, I think the important question is whether prices of securities have become cheap even with the expectation of a recession.
Figure 1: Stocks and corporate bonds plunged in 1Q20
In times of heightened uncertainty like now, I think it is important to take stock of the things that we know, things that we have no idea of, and those that we can speculate (hopefully intelligently) at. It is also necessary for us to differentiate between these three categories, because it is a surefire way to lose money on our investments if we keep betting on things that we don’t/can’t know (or can only guess at) with the mistaken confidence of it being a known fact. (Because the confidence in your hypothesis is likely to lead you to pay a price that provides little margin for error.)
I will catalogue some of these elements here and provide my response to them. For things that I do not know, I will borrow the forecasts of others as an illustration of the potential outcome, but not necessarily because I think they are correct. I will also offer my views as to the ideal course of action for long-term investors in this environment, and highlight a few bond ideas along the way.
What do we know?
There is no avoiding recession
With governments forced to implement containment measures to try to get the virus under control, and countries experiencing a sudden drop in economic activities, it is common knowledge that the global economy is destined for a serious recession. What is the exact impact on GDP, and how long will the recession last? Unfortunately, I categorize these questions under the list of unknowns, but you can decide whether you agree with the forecasts below.
- The IMF said the world economy is likely to go through a “recession at least as bad as during the global financial crisis or worse.”
- Bloomberg Economics are predicting the global economy to shrink 0.2% this year.
Corporate defaults will spike
As the world slides into recession and lockdown measures put severe pressure on cash flows and earnings of businesses, liquidity in funding markets will freeze. Even financially sound companies might find credit expensive or difficult to obtain. Unsurprisingly, all three major credit rating agencies have predicted for default rates to jump. Moody’s forecasted default rate of speculative-grade corporates to climb to 6.8% in a sharp-but-short downturn scenario, and potentially hit 20.8% if the world goes through a severe recession that is worse than the last crisis.
Policymakers are pulling out all the stops
In response to the sudden stop of the economy, policymakers worldwide have taken unprecedented fiscal and monetary actions. The US Federal Reserve cut interest rates to zero and announced historic measures including the purchase of hundreds of billions of Treasuries, corporate bonds, and mortgage-backed securities. On the fiscal side, Washington passed the CARES Act, a USD 2 trillion economic relief package largest in history and equivalent to about 9% of US GDP.
In the euro area, the European Central Bank announced in mid-March the Pandemic Emergency Purchase Program worth EUR 750 billion to purchase private and public sector securities, and later scrapped issue limits on the bond-buying program. Meanwhile, our own Singapore government introduced economic stabilization packages totaling S$59.9 billion, or about 12% of GDP.
Prices of financial assets are a lot lower in the absolute
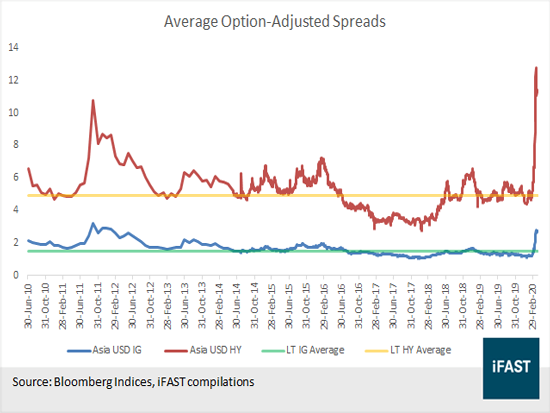
As highlighted earlier, the first quarter of 2020 witnessed one of the worst financial market routs historically. The current financial market turmoil has wiped out years of gains in a matter of weeks. Credit spreads on corporate bonds widened significantly, particularly for high-yield credits (see Figure 2). Plunging prices have translated to a ballooning amount of bonds trading at distressed levels, or at yields of at least ten percentage points above benchmarks.
Figure 2: Corporate credit spreads have widened sharply
The unknowns
How many people will the coronavirus infect and kill? When will the virus recede?
Scientists are struggling to find answers for these questions, and their predictions vary wildly, so you should be skeptical of estimates from any non-scientist.
- Joseph Wu and his fellow researchers concluded that “at least one-quarter to one-half of the population will very likely become infected” in the absence of drastic containment measures or a vaccine. Wu et al estimated the fatality rate of patients who show symptoms of the disease at approximately 1.4%.
- A study published by Verity et al in March put the fatality rate at 0.66%.
- Singapore’s Foreign Minister Vivian Balakrishnan—a trained medical doctor—suggested in March that the pandemic and its economic aftermath is going to last for “at least a year”.
Are the monetary and fiscal stimulus working?
It is still too early to know whether the flood of monetary and fiscal measures would prevent the economy from unravelling, and their effectiveness will vary a lot by country. Thus far, liquidity appears to remain constrained, judging by significantly wider bid-ask spreads across global bond markets, especially for high-yield (“HY”) bonds.
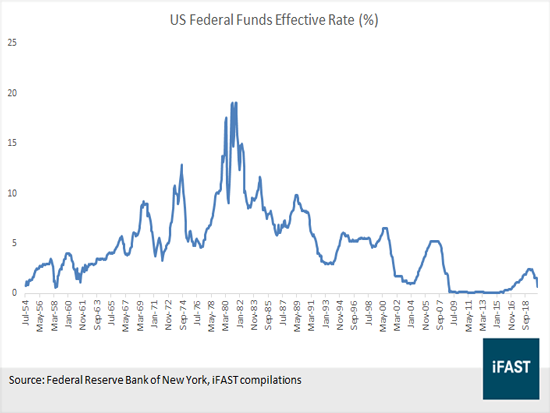
Years of negative-to-low interest rates or bulging fiscal deficits have limited the policy tools available to some countries like the US and Europe. For instance, the usual rate cutting cycle in the US covers around 500 bps (see Figure 3), so the 150 bps cut by the Fed in March is likely to be lesser in its impact. On the other hand, there appears to be more room for aggressive policy easing in countries like China and Singapore.
Figure 3: Fed funds rate history
Have financial markets bottomed?
If we define the “bottom” as the day when financial markets reach their trough and a rebound happens thereafter, I think it is impossible for anyone to know whether markets have already bottomed. For us to have a correct answer, we not only need to accurately predict the effectiveness of current containment measures, how fast the economy could restart when shutdowns are lifted, but perhaps more importantly (and more difficultly), how market participants would react to these variables in the interim. For instance, infection and death rates could slow down because of countermeasures or early invention of vaccines, but asset prices might still decline if the economic recession is steeper or longer than expectations.
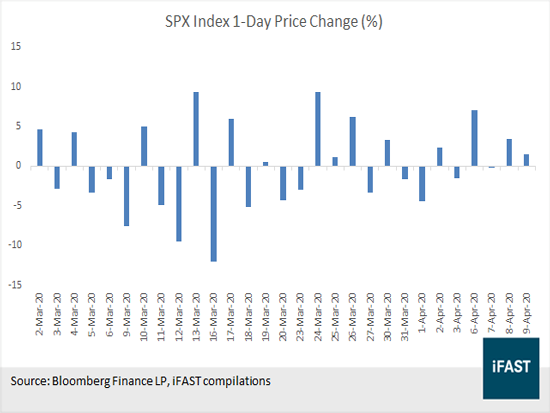
If I have to make a guess at this, I would say that it is unlikely that we are already at the capitulation stage of the current market crash. Looking at equity markets and specifically the S&P 500, while March has given us some of the sharpest declines in history, almost all of the biggest downward movements were followed by substantial gains (see Figure 4), even when there was little evidence of improvements in fundamentals. In fact, last week US stocks posted the biggest weekly gain since 1974. I see this as a sign that there are still some optimism among investors.
Figure 4: Daily price movements of the S&P 500
But I think whether my guess proves to be correct eventually is beside the point, and I certainly wouldn’t make investment decisions based on this speculation. Again, nobody knows what the market is going to do. If you think otherwise, congratulations, all you have to do is trade according to what you think is going to happen and you should get fabulously rich if you’re right.
I prefer instead to rely on the most reliable approach to investing, which is to buy when we can access value cheaply. In other words, the more important question to me is, am I getting my money’s worth (the price I pay) for the future earnings power (the value I get) I am buying? Those will be the two primary determinants of your investment profits over the long run. While I assert that it is impossible for someone to predict (correctly all the time) how the market would behave in the short run, everyone should be able to ascertain whether they are making an intelligent investment given the price they pay.
Think about it this way, if you own a hotel or another business that has been performing well prior to the crisis, would you rush out to sell now because you think you can buy it back sometime later at a cheaper price? Even though, unlike stocks and bonds, we can’t make buy/sell decisions every second for a real asset or business, our approach to invest intelligently should be similar for both.
A couple of my guesses (or hope)
The coronavirus is unlikely to overtake Spanish flu as the deadliest pandemic in modern history
While there are similarities between the two pandemics, COVID-19 is not the Spanish flu. The 1918 influenza pandemic infected about one-third of the planet’s population at the time and killed approximately 50 million victims (estimates vary). The Spanish flu also led to a “sharp and persistent fall in real economic activity”, according to a study by Federal Reserve researchers. (As an aside, although the Spanish flu killed more people than World War I, it did not fundamentally change life as we knew it, and certainly did not make valuing business impossible.)
COVID-19 is a new virus and undoubtedly a major threat in our vastly more populous and interconnected world. However, although we shouldn’t settle on early presumptions and forecasts, we should assess our current understanding of the outbreak in context. And the one consistent trend of diseases and pandemics over the course of history is the gradual reduction in the fatality rate, along with advances in quality of healthcare and scientific knowledge of infectious pathogens.
This is a good time to invest
Even though I mentioned above that nobody knows whether financial markets have bottomed, I think current valuations and market conditions are telling us now is a good time to invest. It may not be the best time, but if you agree with my earlier argument, you shouldn’t wait for the bottom.
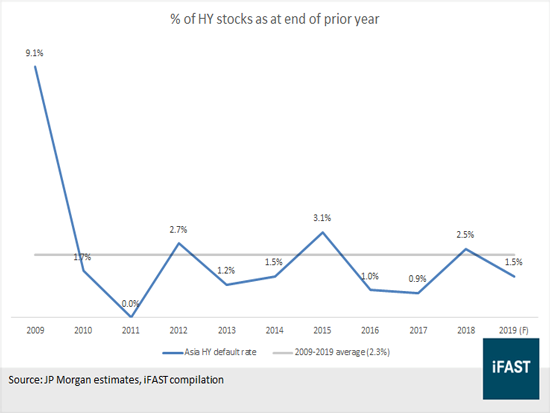
With credit spreads at double digits, Asian HY bonds will need lots of bad things to happen for buyers at current prices to suffer aggregate losses. For example, a quintupling of the historical average default rate of the universe (see Figure 5).
Figure 5: Asia HY default rate 2009-2019
Although the outlook for eventual strong HY market performance has improved, some might argue that current valuations still have not provided enough scope for potential negatives, such as the 20.8% default rate forecasted by Moody’s in a depression scenario. But I think current prices are already factoring in a low level of optimism, provide substantial margin for error, and offer high potential capital gains if things just take a slight turn for the better. Even assuming the doomsday scenario of a 20.8% default rate in a year’s time, defaults at that record level would have to happen every year—not just once—for someone holding a diversified HY portfolio to suffer permanent losses. His losses would also, in all likelihood, be manageable given current valuations and potential recoveries from defaulted bonds.
Above all, I am not saying that you should invest all your money. If you feel strongly that the worst has yet to come and asset prices will decline accordingly, you can always invest some of your money now and save the rest to take advantage of future bargains.
On the other hand, if you care only about protecting yourself against mark-to-market losses and don’t mind the opportunity cost of staying on the sidelines, then you can stay in cash. But in that case you should ask yourself whether you are, in the long run, a net buyer of stocks and bonds. If the answer is yes, you should want the market to go down every once in a while, and that is happening right now. As usual, Warren Buffett had a terrific way of putting across the same point, “If you plan to eat hamburgers throughout your life and are not a cattle producer, should you wish for higher or lower prices for beef?”
Some bond ideas
If like me, you refuse to believe that the long-term outlook for global businesses and productivity has been permanently impaired over the course of three months, there are plenty of opportunities available in the financial market today. However, given our expectation for a sharp rise in default rates, this is not a categorical recommendation to invest in all HY bonds, especially not for individual investors who are unable to hold a well-diversified basket. Instead, you should focus on companies with strong liquidity positions that can weather the current storm. We highlight some of our favorite bond ideas below.
HSBC 4.700% Perpetual Corp (SGD); DBSSP 3.600% Perpetual Corp (USD)
Rarely can we use the words “FOMO” and “panic” to describe the same thing within a span of weeks, but that is arguably what happened to investors’ attitude toward bank capital instruments. A darling of yield-seeking investors prior to the crisis, they are now shunned by most people due to concerns over the severely weakened operating environment and lower interest rates, both of which put pressure on bank earnings.
Before the crisis, I didn’t see much skepticism about the structural deficiencies of Additional Tier 1 (“AT1”) instruments—e.g. no defined maturity date, absence of interest rate step-ups, and deferrable non-cumulative distributions—and investors preferred to pay attention only to the yield premiums of AT1s above senior or Tier 2 issues. Now, everyone is cautious of these same features and brushes off the significantly higher implied yields.
HSBC Holdings PLC is one of the banks that is hit harder than the rest by the selloff in bank capital instruments. The lender’s February announcement of its third major business restructuring since the 2008 GFC didn’t please investors, and the COVID-19 crisis is sure to throw a spanner in its restructuring plan. As reported by the media, HSBC has already put on hold its plan to cut 35,000 jobs due to the impact from the coronavirus pandemic.
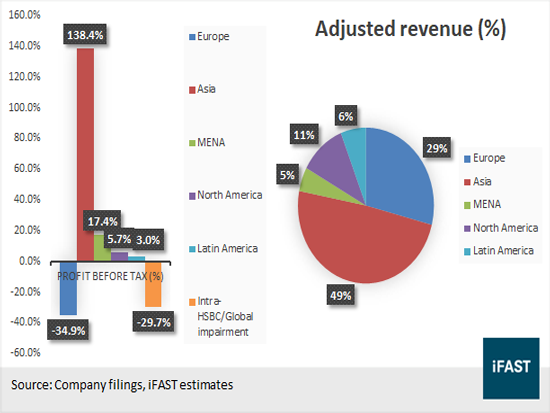
In addition, investors are concerned about HSBC’s shifting risk profile away from its traditional strength as a globally diversified bank. While Asia made up 49% of the bank’s adjusted revenue in 2019, the region contributed substantially all of its profit before tax (see Figure 6).
Figure 6: Adjusted revenue and profit before tax by geographical regions
The bank’s security prices plunged further following its announcement two weeks ago to suspend dividends until the end of 2020. Falling from a high of around 102.2 (yield to call: 3.74%) in January, the HSBC 4.700% Perpetual Corp (SGD) (issue rating: Baa3/BBB by Moody’s/Fitch) had an indicative ask price of 92.3 as at 9 April, which translated to a yield to call (“YTC”) of 8.69% or yield to worst (“YTW”) of 4.20%.
Lost amidst the sea of negatives was the point that HSBC and other major UK banks suspended their dividends following a formal request by the country’s financial services regulatory body, not because of a liquidity crunch. HSBC’s capital position is at a historically sound level, with a CET1 ratio of 14.7% at the end of 2019 that compares well with global peers, and up from previous year’s 14.0%. While market participants are fretting over HSBC’s large exposure to Hong Kong and China, this could actually help the bank outperform its European peers over the COVID-19 crisis, as the two markets appear to be better placed to recover faster.
We think the HSBC 4.7% perps (first call/reset: June 2022) are attractively priced, with yields that are close to lower-rated and longer-duration peers. For instance, Standard Chartered PLC’s 5.375% SGD perps (first call/reset: October 2024) offered YTC and YTW of 8.58% and 5.41% respectively, and carried credit ratings of Ba1/BB-/BB+. Investors who prefer to be positioned more defensively can consider instead DBS’s DBSSP 3.600% Perpetual Corp (USD). The DBSSP 3.6% perps callable September 2021 are rated Baa1 and BBB by Moody’s and Fitch respectively, with a YTC of 6.55% (YTW: 3.10%).
PMALMK 4.800% 30Oct2022 Corp (USD)
Press Metal Aluminium Holdings Berhad is the largest aluminum producer in Southeast Asia, with a total production capacity of 760,000 metric tons (“MT”) per annum. The company’s operating capacity is almost thrice that of the next biggest competitor in the region, PT Indonesia Asahan Aluminium, which has a capacity of 260,000 MT.
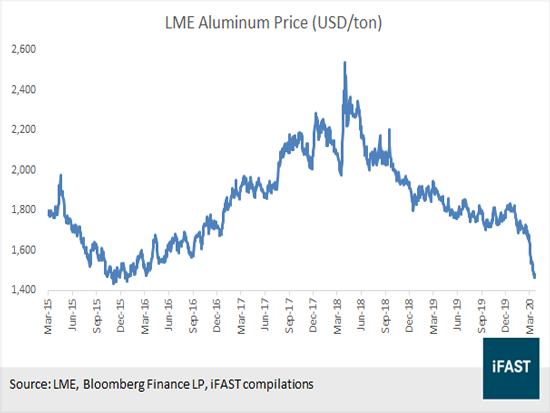
Market observers are expecting a challenging outlook for aluminum producers, with demand from key consumer sectors such as transportation, construction and aviation likely dampened by the coronavirus pandemic. The subdued demand outlook exacerbates existing headwinds from the US-China trade war and declining aluminum prices since mid-2018 (see Figure 7).
Figure 7: Aluminum prices are near four-year lows
As aluminum prices plunge, more than 50% of producers globally are operating at a loss, according to Wood Mackenzie and JPMorgan Chase & Co (as reported by Bloomberg). The pessimistic outlook surrounding aluminum producers pushed prices of the PMALMK 4.800% 30Oct2022 Corp (USD) from around par in late February to 77.4 (ask) on Thursday, which translated to a YTM of 15.9%.
My colleague Ganageaswaran Arumugam wrote a report last week to point out that the PMALMK 4.8% ‘22s were oversold amid the indiscriminate selloff of HY bonds. Ganageas argued that Press Metal’s competitive advantages should help it tide through the downturn. The company is in the first quartile of global aluminum producers in terms of its production cost, supported by its economies of scale.
Press Metal also has adequate liquidity, with access to credit lines of up to RM 2.4 billion according to a report by RAM Ratings dated August 2019. The bank facilities, together with the company’s cash position (31 Dec 19: RM 313m) and strong operating cash flows, comfortably cover its short-term borrowings of RM 612m. I estimated that Press Metal generated funds from operations (after net interest expense and taxes) of RM 1.27 billion and RM 972m in 2018 and 2019 respectively.
Based on Ganageas’s projections, Press Metal is likely to remain marginally profitable even under some rather punitive assumptions. We think this would be an impressive achievement in this operating environment, and indicated the company’s high capacity to weather current headwinds.
FUTLAN 6.150% 15Apr2023 Corp (USD)
Seazen Group Limited is a leading property developer in China’s Yangtze River Delta region, focusing on residential development. The group’s primary operating subsidiary, Seazen Holdings Co., Ltd, ranks eighth among Chinese developers in terms of overall strength, and contributed close to 99% of the group’s revenue in 2019.
Seazen Group demonstrated its resilience following the arrest of its ex-chairman in July. The group maintained its full-year sales target of RMB 270 billion despite going through a management transition, and achieved contracted sales of approximately RMB 270.80 billion, representing a year-on-year (“YoY”) increase of 22.5%.
More importantly, Seazen Group seemed to have taken on a more conservative financial philosophy, likely a defensive move to facilitate the management transition. The timing was fortuitous as the group now has significantly more financial headroom to manoeuvre the global pandemic.
Reported net debt over equity improved significantly from 78.6% in 2018 to 38.5% in 2019, as total cash including restricted cash rose to RMB 65.6 billion. The current cash balance can cover 1.6x short-term financial liabilities (RMB 41.07 billion) or almost three quarters of total debt. Seazen Group announced in July its asset disposal plan to divest up to RMB 15 billion worth of projects, which should further improve its liquidity position and leverage.
Seazen Group’s liquidity risk is low due to its comfortable cash balance and good access to funding. Although the parent company itself did not tap the bond market thus far this year, its subsidiary New Metro Global Ltd raised USD 350m (~RMB 2.5 billion) in offshore notes at 6.8% in January. Seazen Holdings subsequently issued two onshore bonds totaling RMB 1.35 billion at 5.10% and 4.27% in March, notwithstanding the risk-off sentiment amid the coronavirus pandemic.
Similar to most of its Chinese peers, Seazen Group’s aggregate contracted sales declined in the first quarter of 2020, dropping 34% year-on-year (“YoY”) to RMB 30.98 billion. However, even if we assumed the same pace of sales performance for the rest of 2020 due to the virus situation, the annualized contracted sales of around RMB 124 billion would still cover around 1.4x of the group’s total debt. Seazen Group has a contracted sales target of RMB 250 billion for 2020.
Seazen Group has credit ratings of Ba2/BB/BB and we like the company’s FUTLAN 6.150% 15Apr2023 Corp (USD) at its ask YTM of 9.01%. Despite the recent recovery in prices, the FUTLAN 6.15% ‘23s are still trading close to or wider than some lower-rated peers. For example, the CAPG 7.95% ‘23s of China Aoyuan (B1/B+/BB-) offer a YTM of 8.34%, while the CIFIHG 7.625% ‘23s of CIFI Holdings Group (Ba3/BB/BB) yield 7.19%.
ESRCAY 6.750% 01Feb2022 Corp (SGD)
ESR Cayman Limited is a leading Asia Pacific-focused logistics real estate company with total assets under management (“AUA”)—held on the group’s balance sheet and in funds and investment vehicles managed by the group—of USD 22.14 billion at the end of 2019. As illustrated in Figure 8, 56% of ESR Cayman’s AUA is located in China, Singapore, and South Korea, countries that have been more successful in containing the coronavirus.
Figure 8: ESR Cayman’s heavy exposure to Asia
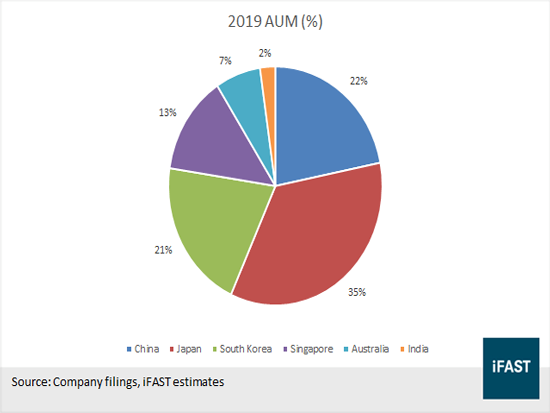
Furthermore, we expect ESR Cayman to be resilient in the global pandemic given its focus on logistics facilities in Asia. Containment measures imposed globally are likely to accelerate the trend of online’s rising share of worldwide retail sales, driving demand for logistics properties. In 2019, Asia was the fastest-growing e-commerce region, and China was once again the top market in terms of total online retail sales. With more than 60% of its tenants as e-commerce and third party logistics companies, ESR Cayman is in a good position to continue growing profits despite macroeconomic headwinds.
According to ESR Cayman’s 2019 financial results release, the group’s operations have seen minimal disruption caused by COVID-19. As of March, only two out of the group’s 43 constructions projects are put on hold due to government orders, and only two out of 157 operating assets are temporarily closed.
Subsequent to ESR Cayman’s IPO in 2019, the group has improved substantially its funding profile. ESR Cayman managed to raise in February USD 250m of three-year unsecured bank loans at a rate of LIBOR plus 3%, and printed S$225m (~USD 166m) of five-year bonds at 5.1%. According to the group, the costs of these financings were more than 150 bps lower than pre-IPO.
ESR Cayman has a strong liquidity position with a cash balance of USD 884m at the end of 2019, while current borrowings were USD 232m or around 10% of total borrowings (USD 2.34 billion). Reported adjusted EBITDA jumped 50% YoY to USD 358.9m in 2019, which translated to a net debt over EBITDA of 4.7x. We like that ESR Cayman’s fund management business—which generates wider profit margins with less capital requirements—continued to grow, with segmental results (excluding fair value changes) of USD 131.8m up 20% YoY and comprising around 40% of the group’s results before corporate items.
Amid the broader market weakness since February, the ESRCAY 6.750% 01Feb2022 Corp (SGD) has fallen to around 97.5 (ask) on 9 April, indicating an attractive YTM of 8.26%. In late February, the notes were offering yields of ~4.5% at around 104. We think the market rout offers a good chance to invest in the credit of this fast-growing logistics fund manager, owner, and developer.
STSP 2.895% 07Mar2023 Corp (SGD)
In a true market panic, the correlations of all assets go to one. Amid the coronavirus-induced selloff, we have seen less risky asset classes like investment-grade bonds being dumped by investors as they fled to the safety of cash and gold.
One example is the STSP 2.895% 07Mar2023 Corp (SGD) of Singapore Telecommunications Ltd (“SingTel”). Trading at around 102 (ask) for a YTM of 2.18% and a tight spread over swaps of 110 bps as of end-February, the notes have declined to almost par with a YTM of 2.82%. The latest YTM translates to spreads that are nearly double than before—214 bps—and we think offer a great opportunity for conservative investors to buy into this A-rated bond.
SingTel’s operating revenue declined 3% YoY to S$12.64 billion in the nine months ended December (“9MFY20”). EBITDA and share of associates’ pre-tax profits (“adjusted EBITDA”), on the other hand, grew 2% YoY to S$4.7 billion, supported by improved operational performances of Airtel and Globe.
Reported gross debt jumped 25% to S$13.03 billion in 9MFY20, following the adoption of new lease accounting standards (SFRS(I) 16) that added S$2.25 billion of secured borrowings. Net interest expense (excluding other noninterest finance items) also climbed 21% YoY to S$346m in 9MFY20, with most of the increase coming from SFRS(I) 16. Nonetheless, SingTel’s credit metrics remained strong with net debt over (annualized) adjusted EBITDA of 2.0x and interest coverage (adjusted EBITDA over net interest expense) of 14.0x in 3QFY20.
SingTel’s liquidity is adequate although it had just S$576m of cash at the end of 2019, versus S$3.34 billion of short-term borrowings. The group generated S$2.74 billion of free cash flow (including dividends from associates) in 9MFY20, up 8.3% YoY, lifted by an increase in national broadband network migration revenues in Australia.
The management expected free cash flow, excluding spectrum payments and dividends from associates, to be around S$2.3 billion for the financial year ending 31 March. Dividends from the regional associates were expected to be approximately S$1.3 billion. Also, we expect SingTel to continue to enjoy good access to funding given its strong investment-grade credit ratings of A+/A1.
Declaration:
For specific disclosure, at the time of publication of this report, IFPL (via its connected and associated entities) has a principal position in DBSSP 3.600% Perpetual Corp (USD), ESRCAY 6.750% 01Feb2022 Corp (SGD), FUTLAN 6.150% 15Apr2023 Corp (USD), HSBC 4.700% Perpetual Corp (SGD), and PMALMK 4.800% 30Oct2022 Corp (USD). The analyst who produced this report holds a NIL position in the abovementioned securities.