Company background
Sembcorp Industries Ltd (“SCI”; Bloomberg Ticker "SCI SP") is a Singapore-based group that focuses in the utilities, marine and urban development business. SCI is well-positioned in the Gas & Power, Renewables & Environment as well as Merchant & Retail sectors with an energy portfolio of over 12,600 megawatts. The company’s energy portfolio consists of thermal power plants, renewable wind and solar power assets.
SCI is listed on the SGX Mainboard with a market cap of S$2.8 billion as at 9 Apr 20. The group is largely owned by Singapore’s state-owned investing arm Temasek Holdings which holds 49.6% of its shares (as at 31 Dec 19).
Some of its key subsidiaries include Sembcorp Marine Ltd (“SCM”), in which SCI holds an effective stake of about 61%. SCM is also listed on the SGX Mainboard with a market cap of S$1.5 billion at the close of yesterday.
FY19 Results
Due to the lacklustre performance of its marine segment, SCI’s overall revenue fell 18% YoY to S$9.6 billion. Per SCM, there were lower revenue recognition from rigs and floaters and offshore platform projects during the year. As a result of a drop in business activity, operating loss in the Marine segment widened to S$143m (FY18: S$60m).
Revenue from the energy (previously known as utilities) segment also fell 6.1% YoY to S$6.1 billion (FY18: S$6.5 billion), mainly due to a smaller contribution in the Singapore unit, in conjunction with lower gas sales and the planned major maintenance shutdown for some of its power generation plants. The shutdown of a thermal plant in India and absence of revenue from a divested South-Africa plant also contributed to the decline in the group’s top-line.
However, SCI’s energy segment reported a profit from operations before exceptional items (“PFO”) of S$894m, up by S$72m from the previous year on the back of business improvements in its Bangladesh, China, India and Myanmar energy operations. We think cost savings corresponding to lower segment revenue also helped to improve PFO. Finally, its urban segment posted a PFO of S$177m, more than doubled from S$78m lifted by better performance of its Vietnam operations.
In line with the decline in revenue, cost of sales (“COS”) contracted at a similar pace of 19% YoY to S$8.7 billion. Included in COS were a number of one-off items, such as impairment losses of S$81m and S$64m on property, plant and equipment, and intangible assets respectively. These impairment losses arise from its UK Power Reserve (“UKPR”) assets as well as Chile water business, due to unfavourable market conditions.
There were also impairment costs on goodwill and assets reclassified to held for sale recorded as part of non-operating expenses. These amounted to S$65m and S$64m, which were also related to the UKPR and Chile water plants respectively. As guided by the company via its SGX announcement dated 6 Feb, overall profit before tax fell 30% YoY to S$295m mainly due to these impairment charges.
Excluding the impairment costs and gains arising from disposals made during the year, we arrive at an EBITDA of S$1.7 billion for the year, up from S$1.5 billion in the previous financial year. This covers about 3.0x (FY18: 2.9x) of its interest expenses, which increased 15% YoY to S$586m.
Credit highlights
As at 31 Dec 19, Sembcorp’s total debt load stood at S$10.8 billion, up slightly from S$10.7 billion as at 4Q18. Meanwhile, cash fell to S$1.8 billion from S$1.9 billion over the same period. Gross net gearing (net debt/ equity) climbed to 1.2x, up from 1.1x as at 4Q18. Including S$801m of perpetual securities as debt, adjusted net gearing would have risen to a high level of 1.4x.
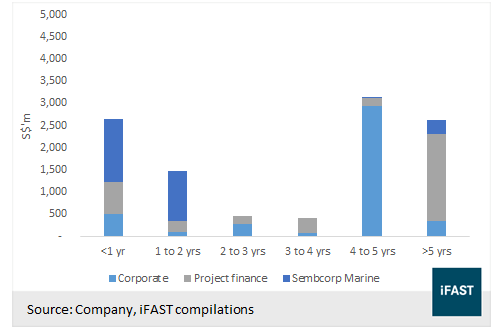
Short term obligations amounted to S$2.6 billion, of which S$674m are secured against net assets and stakes of its subsidiaries, property, plant and equipment and other assets. The cash balance of S$1.8 billion is insufficient to cover short term debt even if we assumed that the secured portion of S$674m can be refinanced.
Included in the short term debt are S$1.4 billion undertaken by SCM. Per SCI, its marine subsidiary is working with lenders to refinance a loan that would lead to a change in its debt maturity profile. In addition, the group disclosed that it has at least S$1.0 billion in committed revolving credit facilities with final maturity dates beyond 2022 that can be drawn down to boost liquidity. In the longer term beyond one year, we see a manageable debt maturity profile with most of its debt coming due only in 4 to 5 years’ time (see Figure 1).
Figure 1: SCI’s debt maturity profile as at 31 Dec 19
Since 2018, Sembcorp has been progressively divesting some of its operations, such as waste paper recycling, medical waste operations and stakes from various other entities. Divestment proceeds since the beginning of 2018 have exceeded the target of S$500m to S$600m. In view of a challenging business outlook which is expected to be affected by weakening energy prices and the impact of COVID-19, we continue to expect SCI to explore alternative options, including the potential monetisation of its non-profitable operations.
In our view, prolonged weakness in the marine segment suggested the need for closer performance monitoring. Since the drop in oil and gas prices from 2015, its marine business has been struggling to deliver profits. In FY19, SCM’s revenue fell 41% YoY to S$2.9 billion with losses before tax widening to S$177.0m (FY18: S$100.9m loss). The weakness in turnover was mainly due to lower revenue recognition from rigs and floaters and offshore platform projects.
Besides weakening operating performance, SCM’s credit profile also deteriorated. As at 31 Dec 19, SCM’s net gearing stood at 1.8x, reflecting an increased debt load of S$4.4 billion, up from S$4.2 billion as at 4Q18.
In addition, the subsidiary’s interest coverage ratio (EBITDA/interest) narrowed to 0.8x (FY18: 1.4x) compared to its zenith of more than 143.8x when earnings reached a record high in 2010. The current debt-to-EBITDA level of 42.3x suggested an extensive reliance on debt to support operations. In our view, SCM’s elevated gearing metrics and persistent downward trend in operating performance will continue to be a drag on SCI’s credit profile.
On the flipside, we take comfort that SCM continues to enjoy significant market share as one of the oldest and largest shipbuilder in Singapore. Evidently, SCM still has access to major shipyards in Singapore including those at Tuas South and Admiralty Road. As such, the company is likely to play an important role in the state economy, especially when the sector generated S$10.3 billion of turnover in 2018 and employed over 100,000 workers.
SCM’s large operating scale and strategic importance signals possible institutional support in a time of need. Last year, SCI issued a S$1.5 billion 5-year 3.55% fixed rate bond via a private placement in which Temasek Holdings participated as an investor. The notes were later extended to SCM for the subsidiary to retire some of its short term debts. SCI will also provide S$500m of working capital support to be funded by its existing resources and facilities.
Business outlook
Looking ahead into 2020, SCI expects the performance from its energy segment to be lower than 2019 due to a loss of contribution from divested assets, the absence of one-off income in Myanmar and the potential impact from the COVID-19 situation.
The energy business continues to undergo business transformation, as energy production will deviate from a reliance on fossil fuels to renewable energy. Such trends have prompted industrial players, including SCI, to change its energy portfolio mix into one that has a higher focus in renewable energy. As SCI continues to reshape its portfolio towards renewables and sustainable solutions, a full transition to the renewable space will take time to materialise.
As highlighted earlier, SCI’s marine segment is expected to stay challenging as business activities for all segments remained low. Thankfully, SCM’s repair and upgrade segment should continue to improve supported by an International Maritime Organization regulation which requires installation of ballast water treatment systems and gas scrubbers.
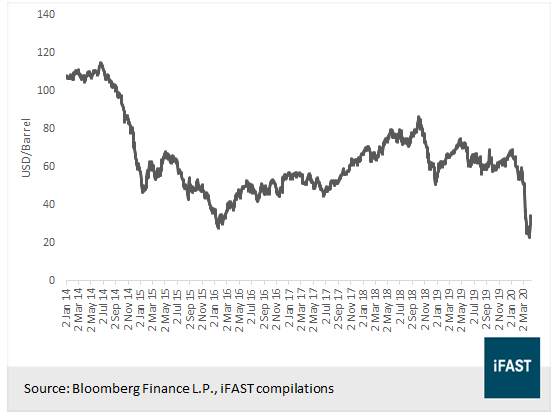
However, SCM’s key segment which involves the building of rigs and floaters, will continue to face challenges. Hopes for a sector recovery have faded following the recent plunge in oil prices (see Figure 2) as SCI expects the loss-making trend in SCM to extend into 2020.
Figure 2: Oil prices (Brent crude) since 2014
Finally, SCI’s urban development segment, which accounted for 47.4% of the group’s net profits for the year ended 31 Dec 19, generated a stable net profit of S$117m in FY19 (FY18: S$86m), boosted by steady contributions from its Vietnam projects and sale of residential development in China. The segment is expected to perform well for the foreseeable future, with a strong net orderbook maintained at 423 hectares (FY18: 425 hectares), largely attributable to the strong demand for land in Vietnam.
Overall, we continue to expect the energy and urban segments to remain as key business engines for the conglomerate. Project undertakings from these segments should continue to offer cash flow visibility moving forward. In FY19, SCI generated net cash from operating activities of S$977m, up from S$739m in the previous year.
Bond valuation
Within the SCISP curve including those issued by SCM (see Figure 3), we find that the intermediate part of the curve provides more value for bond investors. Specifically, the maturities between 2024 and 2025—e.g. the SCISP 3.640% 27May2024 Corp (SGD) and SCISP 4.250% 30Aug2025 Corp (SGD)—offer decent yield and spread pick-ups against the shorter tenors.
Figure 3: the SCISP curve (straight bonds)
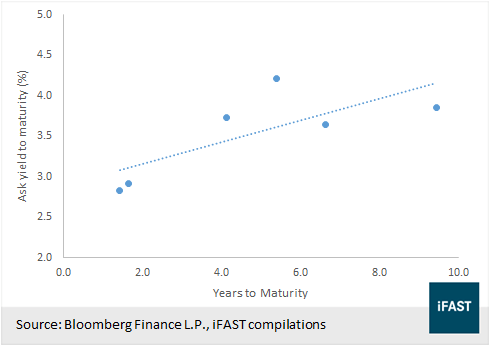
The SCISP 3.64% May’24s and SCISP 4.25% Aug’25s are carrying an ask yield-to-maturity (“YTM”) of 3.71% and 4.01%, offering spreads of 299bps and 329bps above SGD swaps respectively. The latter also provides a decent yield pick-up of 30bps for a 1.3 years longer tenor, giving an reasonable compensation for the duration risk.
These SCISP bonds also compare favourably against other notes. As a reference, Keppel Corporation Ltd’s KEPSP 3% May’ 24s and 3% Oct’ 26s are carrying an ask YTM of 2.97% (Z-spread: 225bps) and 3.1% (Z-spread: 235bps) respectively.
While both conglomerates operate within similar business segments, SCI had a higher financial leverage than Keppel Corporation Ltd (“KCL”) as net gearing for KCL and SCI were 0.85x and 1.2x respectively. KCL also has a more widely diversified income stream and a much larger operating scale underpinned by a total asset size of S$31.3 billion. As such, we believe that the incremental yields offered by the SCISP bonds reflected SCI’s relatively higher credit risk.
Coinciding with the COVID-19 outbreak and collapse in oil prices, interest rates have stayed low since the beginning of this year. Amid volatile changes in prices, we remain overweight on the SCISP 4.750% Perpetual Corp (SGD), and prefer this over the SCISP 3.7% Perps.
The SCISP 4.750% Perpetual Corp (SGD) is first callable on 20 May 2020. If not redeemed on the first call date, the coupon will reset five years later (and every ten years thereafter), with the distribution rate resetting to the sum of the prevailing ten-year SGD swap offer rate, the initial spread of 211bps, and a step-up margin of 100bps.
The SCISP 4.75% Perps are currently offering an ask yield-to-worst/call (“YTW”) of 4.07% (Z-spread: 340bps). Even if we assume conservatively that SCI will redeem the perps only in May 2025, as we think there is a small chance that SCISP may do so given the sluggish performance, we think the yield to reset of 4.80% provides a good compensation for the extension risk and the perps’ subordinated ranking.
Between the two perps, the SCISP 4.75% Perp looks more attractively priced than the SCISP 3.7% Perp by either yield metrics. If we take the conservative assumption regarding the tenor for both perps, which is to assume that the issuer redeems the perps on their respective first reset dates, the SCISP 4.75% perps and SCISP 3.7% perps would yield around 4.80% (Z-spread: 412bps) and 3.68% (Z-spread: 295bps) respectively. As a matter of fact, the YTW of 4.07% and 3.13% for the SCISP 4.75% perps and 3.7% perps respectively also suggested that the SCISP 4.75% perps looks more appealing (see Table 1).
Table 1: SCI’s outstanding perpetual securities
|
Ticker |
Coupon rate (%) |
First call date |
First coupon reset date |
Yield-to-call (%) |
Yield-to-reset (%) |
Yield-to-maturity (%) |
Yield-to-worst (%) |
Issue size ($m) |
|
SCISP |
4.75 |
20-May-20 |
20-May-25 |
4.07 |
4.80 |
4.39 |
4.07 |
600 |
|
SCISP |
3.70 |
22-Jun-20 |
22-Jun-22 |
3.13 |
3.68 |
4.05 |
3.13 |
200 |
|
Source: Bloomberg Finance L.P., pricing data as of 9 Apr 20, iFAST compilations |
||||||||
On the possibility of a call event this year, we think it is highly unlikely that SCI will choose to leave the SCISP 4.75% perps outstanding beyond May 2020, and redeem the SCISP 3.7% perps (with a first call date of 22 Jun 20) one month later. The SCISP 4.75% perps carry a higher coupon rate, which gives SCI more incentive to redeem them. It would also take an unusual combination of events for SCI to risk a reputational hit by redeeming one but not the other within the span of one month.
It is noteworthy to point out that both SCI perps have non-coinciding first call dates and first reset dates. Conventionally, perps are vulnerable to a non-call event in times of low interest rates, as it makes more economic sense for issuers to withhold liquidity. This may not hold true for perps with different call dates and coupon reset dates, as depressed level of interest rates may also encourage issuers to replace the existing perps with lower coupon rate perps.
Ultimately, we think cost-savings will remain as the central motivation for issuers to redeem their perpetual bonds. As such, and as mentioned before, we speculate that SCI will make an effort to maintain a good issuer reputation and consider low interest rates as part of their capital management plans.
Declaration
For specific disclosure, at the time of publication of this report, IFPL (via its connected and associated entities) holds a principal interest in the SCISP 4.750% Perpetual Corp (SGD) . The analyst who produces this report owns none of the abovementioned securities.