
• Hong Kong continues to lead: Operating income rose 8.9% YoY to HKD 11.2 billion in 1H26, with Hong Kong providing about 95% of the increase as both net interest income and fees grew.
• Provisions still elevated: Impairments rose 16.5% YoY to HKD 3.0 billion as Mainland charges more than doubled, keeping net profit flat at HKD 2.4 billion.
• Asset quality mixed: The impaired loan ratio held at 2.71% and coverage improved, but loans overdue for more than three months rose 27.8% in six months to HKD 10.5 billion.
• Funding and capital strong: Deposits fund 74% of the balance sheet, with a healthy liquidity coverage ratio of 167.9% and net stable funding ratio of 125.0%, while the CET1 ratio remains robust at 25.0%.
• About the bonds: We favour the 2032 USD senior non-preferred for its 6.17% yield with an expected tenor of 5 years.
We last covered Bank of East Asia (BEA) back in November 2025. Since then, the bank reported its FY25 (ending 31 December 2025) and 1H26 results (ending 30 June 2026). In the article below, we examine what BEA has been up to and refresh our view on its outstanding USD bonds.
Related articles: Bank of East Asia Strengthens Capital Base — Bond Yields Up to 5.7%!
Revenue Growth Was Led by Hong Kong, While the Mainland and Overseas Lagged
BEA's operating income rose 8.9% YoY to HKD 11.2 billion in 1H26. Hong Kong operations accounted for about 95% of the HKD 908 million increase, with operating income there up 13.2%, while the Mainland grew modestly and overseas operations declined.
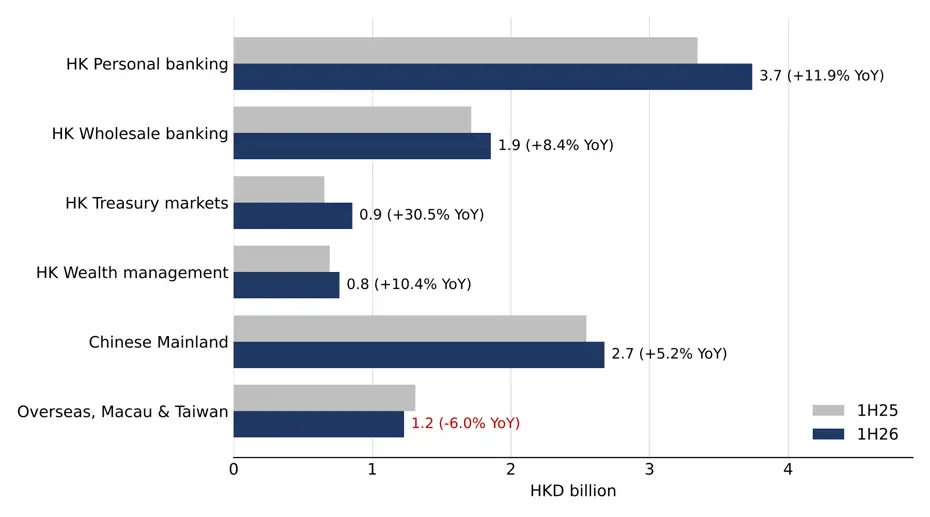
Hong Kong personal banking (see Chart 1 below) was the largest contributor, with operating income up 11.9% YoY to HKD 3.7 billion. Management cited double-digit growth in net interest income (NII) and higher fees, with investment sales income up 22.6% and third-party insurance commissions up 25.4% to HKD 493 million, as its bancassurance partnership with AIA set another record.
Wholesale banking (+8.4% to HKD 1.9 billion), treasury markets (+30.5% to HKD 0.9 billion) and wealth management (+10.4% to HKD 0.8 billion) also grew. Wholesale non-interest income rose 34.7% on transaction banking and treasury products, while private banking income rose 10.9%.
Outside Hong Kong, growth was weaker. Mainland operating income rose 5.2% to HKD 2.7 billion as fee and trading income grew and NII edged up despite a 17bp fall in net interest margin (NIM, net interest income as a percentage of average interest-earning assets). Overseas, Macau and Taiwan income fell 6.0% to HKD 1.2 billion as BEA shifted lending towards lower-yielding investment-grade and large corporate borrowers.
Chart 1: Hong Kong Segments Drove 1H26 Revenue Growth; Overseas Declined
Data as of 30 June 2026
Source: Company data, iFAST compilations.
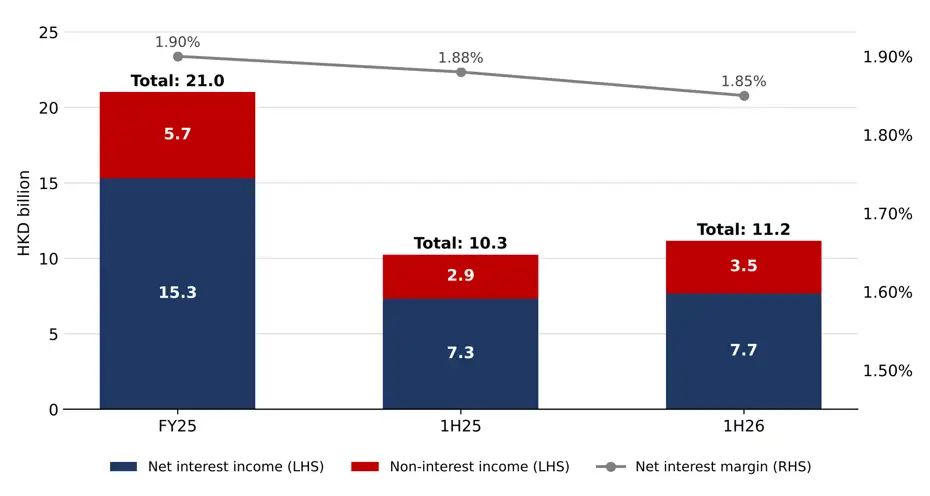
Overall, we like how BEA's revenue growth is becoming more fee-led, with non-interest income at 31% of operating income (1H25: 28%). This trend should provide BEA with a more diversified earnings stream that is not fully dependent on interest rate movements. That said, investment and insurance fees depend on market sentiment. Looking forward, with management expecting rates to stay higher for longer, we expect NII to remain supportive of BEA’s top line. However, we caveat that flat loan growth and a still-easing group NIM suggest any improvement will be gradual.
Chart 2: Fees and Steadier Interest Income Lifted Operating Income, Even as NIM Eased
Data as of 30 June 2026
Source: Company data, iFAST compilations.
Costs Were Held Flat; Provisions Rose on the Mainland Clean-Up
Impairment losses rose 16.5% YoY to HKD 3.0 billion in 1H26 but eased 4.7% from 2H25's HKD 3.1 billion. Loan impairments of HKD 2.9 billion equal an annualised credit cost of about 106bp of average loans (FY25: 102bp; iFAST estimate). Management said most of the charge was related to commercial real estate (CRE): more provisions for Mainland projects facing slower sales, and further impairments after updated valuations of Hong Kong offices and shops.
The split by region matters more than the total. Hong Kong impairments fell 20.0% to HKD 1.2 billion and overseas impairments fell 64.3% to HKD 126 million, but Mainland impairments more than doubled to HKD 1.6 billion (1H25: HKD 698 million), pushing Mainland operations to a pre-tax loss of HKD 516 million. Management ties this to its plan to resolve legacy Mainland problem loans by 2028. We therefore read the rise as a deliberate clean-up rather than a broad deterioration, although it shows the Mainland book still needs work.
Operating expenses were flat at HKD 4.8 billion (+0.1% YoY), as savings elsewhere offset higher staff costs. Staff costs rose 3.5% even though headcount fell 3.1% to 7,617, as BEA kept investing in talent. Meanwhile, internet platform charges fell 27.2% as Mainland online lending volumes shrank, and management credits automation at its Guangdong service centre and wider use of AI for further efficiency gains. With costs flat and operating income up 8.9%, the cost-to-income ratio improved to 43.2% (1H25: 46.9%).
Profitability Is Recovering Slowly from a Low Base
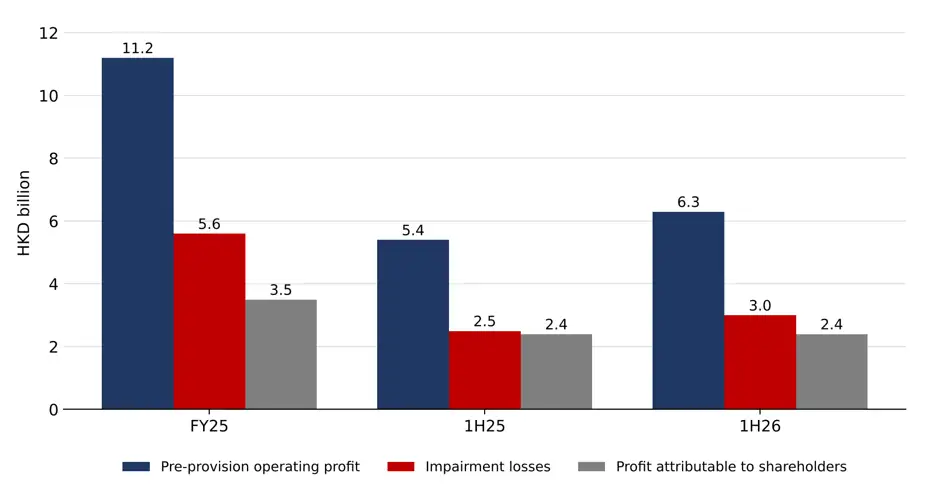
Attributable profit rose just 0.4% YoY to HKD 2.4 billion in 1H26. Pre-provision operating profit (PPOP, operating income less operating expenses) rose 16.5% to HKD 6.3 billion. However, higher impairments, HKD 407 million investment property valuation losses (1H25: HKD 98 million) and a higher tax charge absorbed the gain (see Chart 3 below). The annualised return on equity was 4.6% (1H25: 4.5%).
Do note that the comparison base is weak. FY25 attributable profit fell 24.0% to HKD 3.5 billion (return on equity: 3.1%) after HKD 5.6 billion of impairments and HKD 723 million of property valuation losses. We like that pre-provision earnings are growing on both interest and fees, but better profitability depends on provisions falling.
Chart 3: Higher Pre-Provision Profit Was Largely Absorbed by Impairment Losses
Data as of 30 June 2026
Source: Company data, iFAST compilations.
Outlook: No Numeric Guidance, but Clear 2028 Balance-Sheet Targets
BEA does not publish numeric earnings guidance, so we track its 2026–2028 strategic plan instead (see Table 1 below). The plan rests on three pillars: shifting the loan book away from CRE, growing wealth and cross-border fees, and technology-driven efficiency.
Management's FY25 expectation that Hong Kong asset quality would stabilise in 2026 is so far holding, with Hong Kong impairments down 20.0% YoY. The loan-mix target also looks achievable: non-CRE lending is 83% of the book against an 85% target for 2028, and property loans fell 6.3% in six months. Resolving Mainland legacy loans by 2028 looks more demanding, given rising Mainland impairments and overdue loans.
Table 1: BEA Is Close to Its Loan-Mix Target; the Mainland Clean-Up Has Further to Go
|
Area |
Management target |
Where BEA stands (1H26) |
|
Loan mix |
85% non-CRE by 2028 |
83% non-CRE |
|
Mainland legacy problem loans |
Resolve by 2028 |
Mainland impairments HKD 1.6 billion (1H25: HKD 0.7 billion); Mainland impaired loan ratio 3.24% |
|
Hong Kong asset quality |
Stabilise in 2026 (FY25 outlook) |
Hong Kong impairments down 20.0% YoY |
|
Efficiency |
Technology-driven efficiency gains |
About 15% of operating processes AI-enabled; cost-to-income ratio 43.2% |
|
Data as of 30 June 2026 Source: Company data, iFAST compilations. |
||
Asset Quality: Stable Headline Ratios, but Overdue Loans and CRE Need Watching
Impaired loans were broadly flat at HKD 14.9 billion, or 2.71% of loans (end-2025: 2.69%). Impaired loans are those already in default or judged unlikely to be repaid in full (Stage 3). By borrower location, Hong Kong impaired loans fell to HKD 5.7 billion (end-2025: HKD 6.5 billion) and the Mainland was flat at HKD 7.4 billion, but other Asian markets rose to HKD 1.1 billion from HKD 156 million.
Coverage improved. Loan impairment allowances rose to 1.33% of gross loans (end-2025: 1.10%), and specific provisions covered 39.0% of impaired loans (end-2025: 30.9%; both iFAST estimates). This looks modest on its own, but collateral does much of the work: about 59% of overdue loans are secured by collateral valued at HKD 9.9 billion.
However, the early warning signs worsened. Loans more than three months overdue rose 27.8% in six months to HKD 10.5 billion (1.9% of loans, from 1.5%), led by Mainland borrowers (HKD 5.1 billion, from HKD 2.8 billion), and repossessed assets rose to HKD 1.9 billion from HKD 237 million (see Table 2 below). Since loans that stay overdue tend to be reclassified as impaired, we see upside risk to the impaired loan ratio in 2H26.
CRE remains the concentrated risk. Property development and property investment loans, our proxy for CRE, fell 6.3% to HKD 94.3 billion (17.2% of loans) from HKD 100.7 billion at end-2025, consistent with management's 83% non-CRE figure. Hong Kong property investment loans (HKD 34.4 billion) are 87.8% collateralised, against 59.2% for Mainland property development loans (HKD 15.9 billion). Nonetheless, we see CRE as a concentrated tail risk that BEA is actively shrinking, rather than evidence of broad loan-book deterioration.
Table 2: Coverage Improved, but Overdue Loans and Repossessed Assets Rose in 1H26
|
HKD billion, unless stated |
31 Dec 2025 |
30 Jun 2026 |
|
Gross loans to customers |
549.3 |
549.8 |
|
Impaired loans (Stage 3) |
14.8 |
14.9 |
|
Impaired loan ratio (%) |
2.69 |
2.71 |
|
Loan impairment allowances / gross loans (%)* |
1.10 |
1.33 |
|
Specific provisions / impaired loans (%)* |
30.9 |
39.0 |
|
Loans overdue more than three months |
8.2 |
10.5 |
|
as % of gross loans |
1.5 |
1.9 |
|
of which Mainland borrowers |
2.8 |
5.1 |
|
Property development and investment loans |
100.7 |
94.3 |
|
as % of gross loans |
18.3 |
17.2 |
|
Repossessed assets |
0.2 |
1.9 |
|
*iFAST estimates. Data as of 30 June 2026 Source: Company data, iFAST compilations. |
||
Funding and Liquidity Remain Robust
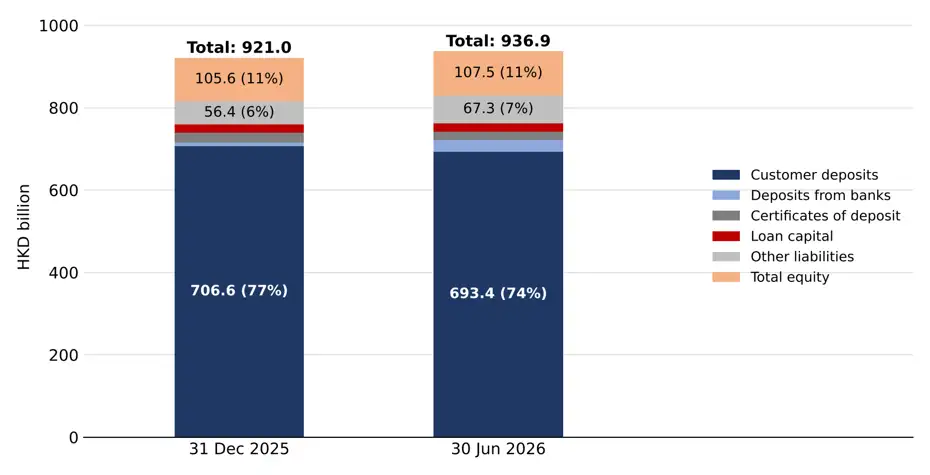
BEA's funding rests on a large deposit base, which funds 74.0% of its balance sheet (see Chart 4 below). Customer deposits fell 1.9% in six months to HKD 693.4 billion while loans were flat, lifting the loan-to-deposit ratio to 77.1% (end-2025: 75.3%). Low-cost current and savings deposits rose to 36.0% of the total (end-2025: 35.6%). Market funding is small: certificates of deposit (HKD 19.5 billion) and loan capital (HKD 20.4 billion) together make up about 4% of the balance sheet.
Market access remains intact. BEA called two USD 500 million senior non-preferred notes in March 2026, then issued a USD 1.0 billion 5.375% senior non-preferred note due in 2032 in May and tapped its RMB notes for RMB 250 million in April. We think these recent issuances strengthen BEA’s funding sources and lower their cost. The new USD note replaced the called 6.625% and 6.75% notes at a coupon 125bp to 138bp lower and pushed their 2027 maturities out to 2032, while the RMB tap and a JPY 5.0 billion note in November 2025 broaden its investor base beyond USD. For bondholders, BEA’s record of calling each note at its first call date bodes well for its next calls in 2027.
Liquidity remains comfortably above requirements, though below its 2025 peaks. The average liquidity coverage ratio (LCR, liquid assets against 30 days of stressed outflows) was 167.9% in 2Q26 (4Q25: 182.8%; 2Q25: 176.5%), and the net stable funding ratio (NSFR, stable funding against longer-term needs) was 125.0% (end-2025: 126.0%), both well above the 100% minimum. Crucially for bondholders, a deposit-funded balance sheet with these buffers gives BEA strong capacity to withstand market stress.
Chart 4: Customer Deposits Fund Three-Quarters of the Balance Sheet
Data as of 30 June 2026
Source: Company data, iFAST compilations.
Capitalisation Remains Very Strong
BEA's CET1 ratio rose to 25.0% at end-June 2026 (end-2025: 24.7%; end-June 2025: 23.7%), about 17.7 percentage points above the 7.3% minimum. Over the six months, CET1 capital grew 2.8% to HKD 92.2 billion, faster than risk-weighted assets (RWA, +1.6% to HKD 368.1 billion). With no AT1 outstanding, the Tier 1 ratio is also 25.0%, while the total capital ratio was 28.4% and the leverage ratio (Tier 1 capital over total exposures, with no weighting) was 9.5% (see Table 3 below).
We would stress that much of the jump since 2024 came from rule changes rather than new capital. The Basel III final reform, effective in Hong Kong from January 2025, lowered risk weights on many secured loans and cut RWA from HKD 486.1 billion to HKD 362.2 billion by end-2025, lifting CET1 from 17.7% to 24.7% while CET1 capital rose only from HKD 85.8 billion to HKD 89.6 billion. That said, even the leverage ratio, which ignores risk weights, is healthy.
Table 3: Capital and Liquidity Stay Far Above Minimums as Profitability Edges Up
|
Key Metrics |
FY25 |
1H25 |
1H26 |
|
Net interest margin |
1.90 |
1.88 |
1.85 |
|
Cost-to-income ratio |
46.7 |
46.9 |
43.2 |
|
Return on average equity (annualised) |
3.1 |
4.5 |
4.6 |
|
CET1 ratio |
24.7 |
23.7 |
25.0 |
|
Total capital ratio |
28.2 |
28.6 |
28.4 |
|
Average liquidity coverage ratio (final quarter) |
182.8 |
176.5 |
167.9 |
|
Net stable funding ratio |
126.0 |
125.0 |
125.0 |
|
Data as of 30 June 2026 Source: Company data, iFAST compilations. |
|||
Risk
For BEA, the specific risks we continue to monitor would be property valuations and associate-related risks, which could cause episodic charges. BEA's investment property portfolio grew to HKD 7.3 billion (end-2025: HKD 5.8 billion) after it acquired subsidiaries holding HKD 1.9 billion of investment properties, adding to the valuation exposure behind this year's HKD 407 million loss. Separately, the market value of its stake in AFFIN Bank Berhad stayed below its HKD 4.0 billion carrying amount, although a value-in-use test (HKD 5.0 billion) avoided impairment. None of these materials appears relative to BEA's capital, but each could dent earnings.
Recommendations
In sum, we believe BEA's pre-provision earnings are recovering, and its capital is very strong, while CRE and the Mainland clean-up remain manageable risks. We maintain our view of a solid credit profile and update our view on BEA's USD bonds.
In Table 4 below, we highlight BEA’s senior non-preferred (SNP) USD bonds. In general, these issues offer yields-to-worst ranging from 5.53% to 6.06% with expected tenors ranging from 0.65 years to 4.51 years. Against other banks’ senior non-preferred bonds, we find BEA’s USD bonds to be fairly priced. Against comparable US Treasuries, these bonds offer a yield spread of 120+bp to 130+bp.
In Table 5 below, we highlight BEA’s Tier 2 USD bonds. In general, these issues offer yields-to-worst ranging from 5.75% to 6.06% with expected tenors ranging from 0.45 years to 2.63 years. Against other banks’ Tier 2 bonds, we also find BEA’s USD bonds to be fairly priced. Against comparable US Treasuries, these bonds offer a yield spread of 130+bp to 140+bp.
Senior non-preferred vs Tier 2. Both rank below BEA’s depositors and senior creditors, but the SNPs are repaid ahead of the Tier 2s if BEA fails, which is why both S&P and Moody’s rate them a notch higher (BBB/Baa2 vs BBB-/Baa3). Their call structures also differ. BEA’s SNPs are callable one year before maturity, so a skipped call extends them by only a year. Its Tier 2s are callable five years before maturity and would extend by five years, though banks usually call them because Tier 2 bonds count progressively less towards regulatory capital over those final five years.
Our preferred pick is the BNKEA 5.375% 13May2032 SNP (6.06% to its May 2031 call, 139.8bp over US Treasuries), which offers a similar spread as BEA’s 2034 Tier 2 (146.1bp) while ranking above it. The shorter BNKEA 5.125% 07Jul2028 SNP (5.53% to its July 2027 call) suits more conservative investors. Both are available on Bondsupermart Live, with a minimum of US$1,000 in US$1,000 increments.
Investors seeking high-quality income from a well-capitalised Hong Kong bank, and who are comfortable with these loss-absorbing features, can consider BEA’s SNPs, with the 2032 SNP as our preferred pick.
Table 4: USD senior non-preferred bonds
|
Issue |
Issuer |
Ask Price |
Yield to Worst / Yield to next call |
Years to Maturity / Years to next call |
Seniority |
Credit Rating (S&P / Moody’s) |
|
Bank of East Asia Ltd |
99.74 |
5.53% / 5.53% |
1.66 / 0.65 |
Senior non-preferred |
BBB / Baa2 |
|
|
Bank of East Asia Ltd |
97.33 |
6.06% / 6.06% |
5.51 / 4.51 |
Senior non-preferred |
BBB / Baa2 |
|
|
BNP Paribas SA |
98.54 |
4.99% / - |
1.02 / - |
Senior non-Preferred |
A- / Baa1 |
|
|
BNP Paribas SA |
99.26 |
5.95% / 5.95% |
6.18 / 5.18 |
Senior non-preferred |
A- / Baa1 |
|
|
BPCE SA |
98.60 |
5.03% / - |
0.95 / - |
Senior non-preferred |
BBB+ / Baa1 |
|
|
BPCE SA |
101.89 |
5.67% / 5.67% |
2.94 / 1.94 |
Senior non-preferred |
BBB+ / Baa1 |
|
|
Deutsche Bank AG / New York NY |
101.68 |
5.23% / 5.23% |
2.19 / 1.19 |
Senior non-preferred |
BBB / Baa1 |
|
|
Deutsche Bank AG / New York NY |
102.74 |
5.37% / 5.37% |
3.03 / 2.03 |
Senior non-preferred |
BBB / Baa1 |
|
|
Data as of 10 November 2026 Source: Bloomberg, Bondsupermart, iFAST Compilations. |
||||||
Table 5: USD senior Tier 2 bonds
Issue | Issuer | Ask Price | Yield to Worst / Yield to next call | Years to maturity / Years to next call | Seniority | Credit rating (S&P / Moody’s) |
Bank of East Asia Ltd | 99.62 | 5.75% / 5.75% | 5.45 / 0.45 | Tier 2 | BBB- / Baa3 | |
Bank of East Asia Ltd | 101.64 | 6.06% / 6.06% | 7.63 / 2.63 | Tier 2 | BBB- / Baa3 | |
BNP Paribas SA | 97.67 | 5.71% / - | 1.64 / - | Tier 2 | - / Baa2 | |
BNP Paribas SA | 98.04 | 5.95% / 5.95% | 6.31 / 1.31 | Tier 2 | BBB+ / Baa2 | |
Deutsche Bank AG / New York NY | 99.79 | 5.94% / 5.95% | 4.66 / 3.41 | Tier 2 | BBB- / Baa3 | |
Deutsche Bank AG / New York NY | 99.04 | 5.83% / 5.83% | 6.06 / 1.06 | Tier 2 | BBB- / Baa3 | |
HSBC Holdings PLC | 110.21 | 6.05% / 6.05% | 6.99 / 5.99 | Tier 2 | BBB+ / Baa1 | |
HSBC Holdings PLC | 96.27 | 6.30% / 6.30% | 9.84 / 8.84 | Tier 2 | BBB+ / Baa1 | |
Standard Chartered PLC | 89.43 | 6.12% / 6.29% | 9.28 / 4.02 | Tier 2 | BBB / Baa2 | |
Data as of 10 November 2026 Source: Bloomberg, Bondsupermart, iFAST Compilations. | ||||||
Declaration: For specific disclosure, at the time of publication of this report, IFPL (via its connected and associated entities) holds BNKEA 4.375% 01Mar2033 Corp (USD), BNKEA 6.750% 27Jun2034 Corp (USD), BNP 4.375% 01Mar2033 Corp (USD), HSBC 5.741% 10Sep2036 Corp (USD) and the analyst who produced this report holds NIL positions in the abovementioned securities. This research report was prepared with the assistance of artificial intelligence (AI) tools. iFAST Financial Pte Ltd does not rely exclusively on AI for content generation; the content of this report – including all investment theses, ratings, price targets and conclusions – has been independently reviewed and verified by the research analyst(s) to ensure accuracy and professional integrity.