
- Strong quarter: 3QFY2026 revenue rose 6.8% YoY to USD 25.2 billion, and segment operating income jumped 21.4% to USD 5.6 billion.
- Experiences anchors the credit: parks and cruises delivered over half of operating income at a 30.3% margin, while Sports fell 17.3% on higher rights costs.
- Leverage edging up, but debt servicing is strong: debt-to-EBITDA is 1.9x, interest coverage is 13.2x, and USD 17.4 billion of liquidity covers short-term debt 2.0x.
- Watch the buybacks: shareholder returns of USD 8.6 billion exceeded free cash flow of USD 5.7 billion.
- Bonds fairly priced: Disney yields in line with the similarly rated Netflix and below the lower-rated Comcast. We prefer the short-dated DIS 7.280% 30Jun2028 at 5.00%.
Company Profile
Founded in 1923 as a cartoon studio, The Walt Disney Company is now one of the world's largest entertainment companies. It owns some of the most valuable franchises in the media industry such as Disney, Pixar, Marvel, Star Wars and National Geographic, alongside ESPN and a global network of theme parks and cruise ships.
The simplest way to understand how Disney makes money is as a flywheel. Its studios create stories and characters, which earn first through the box office, streaming subscriptions and television. Long after a film leaves cinemas, those characters keep generating income through theme park rides, hotel stays, cruises and licensed merchandise.
This is carried out through three segments: Entertainment, Experiences and Sports. Entertainment is Disney’s largest segment by revenue, earning from film releases, Disney+ and Hulu subscriptions, and TV networks such as ABC and FX. Trailing behind on revenue is Experiences, which covers theme parks, cruises and merchandise. It is Disney’s most profitable segment, with an operating margin of almost 30%. Sports, the smallest segment, is ESPN, earning from pay-TV affiliate fees, live sports advertising and its new streaming service, which now includes the NFL Network.
Earnings Surge as Parks and Streaming Drive Growth
For 3QFY2026, ended 27 June 2026, Disney reported a 6.8% YoY increase in total revenue to USD 25.2 billion. Entertainment revenue rose 6.0% YoY to USD 11.3 billion, as an 11.5% YoY rise in subscription and affiliate fees more than offset lower advertising (-1.0%) and content sales (-6.0%). Sports revenue rose 4.5% YoY to USD 4.5 billion, on an 8.4% YoY rise in subscription and affiliate fees, about half of which came from the NFL Network acquisition. Experiences revenue rose 9.7% YoY to USD 10.0 billion, led by a 17% YoY jump in resorts and vacations, 10 percentage points of which came from additional cruise days after two new ships launched. Theme park admissions grew 9% YoY on higher ticket revenue per guest (+5%) and attendance (+3%).
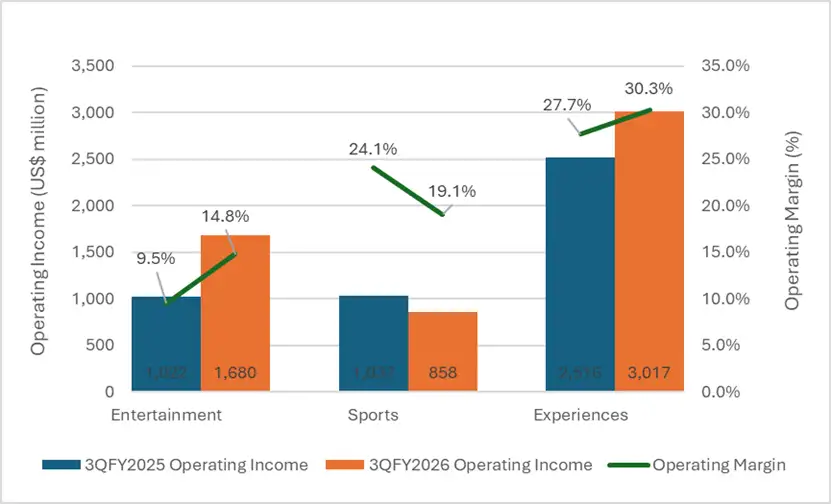
Disney's profits saw bigger movements, with total operating income jumping 21.4% YoY to USD 5.6 billion and lifting total operating margin from 19.3% to 22.0%. As shown in Figure 1, Entertainment saw the sharpest jump. Operating income was up 64.4% YoY to USD 1.7 billion and operating margin rose from 9.5% to 14.8%, as streaming operating income more than doubled to USD 712 million. Entertainment earnings still swing with the film slate, but with streaming now a steady profit contributor, they are less volatile than before.
Experiences remains the largest profit contributor, generating USD 3.0 billion (up 19.9% YoY), more than half of total operating income from under 40.0% of revenue. Its margin widened from 27.7% to 30.3%, although about 4 percentage points of the growth came from a one-off ~USD 100.0 million tariff refund. These hard, owned assets with pricing power make it the most valuable part of the business, though it depends on discretionary consumer and travel spending and absorbs most of Disney's capital expenditure (capex).
The only segment that moved backwards was Sports, where operating income fell 17.3% YoY to USD 858.0 million and the margin narrowed from 24.1% to 19.1%. Programming and production costs rose 10.4% YoY on contractual rate increases, new sports rights and the timing of the NBA renewal. Rising rights costs and the decline of the cable bundle remain a structural pressure, although ESPN's new direct-to-consumer offering gives it a way to reach viewers directly.
Figure 1: Segment Operating Income and Margin (3QFY2025 vs 3QFY2026)
The management expects 4QFY2026 operating income of about USD 4.9 billion, including the 53rd week, up from USD 3.5 billion in 4QFY2025. This represents 40.8% YoY growth, although part of it comes from the extra week. For bondholders, this is a positive sign as it supports Disney’s ability to service its debt.
Disney is also reportedly preparing thousands of job cuts, with some managers asked to target 20.0% in annual cost savings. If carried out, the savings would support margins and cash flow, which is positive for Disney’s ability to service its debt. However, part of the savings will be reinvested in content, technology, parks and cruises, and severance costs could weigh on cash flow in the near term.
Buybacks Are Outrunning Free Cash Flow
On a trailing 12-months (TTM) basis, free cash flow fell 28.2% YoY to USD 8.3 billion, as operating cash flow dropped 11.3% to USD 17.0 billion and capex rose 14.5% to USD 8.7 billion (see Table 1). The fall in operating cash flow is largely timing, as about USD 1.7 billion of FY2025 taxes deferred under California wildfire relief were paid in FY2026. Meanwhile, the higher capex mainly went into new cruise ships and theme park expansions.
In the last nine months, Disney spent about USD 8.6 billion on dividends and buybacks, more than its free cash flow of USD 5.7 billion over the same period. For the full year, management targets at least USD 9.0 billion of share repurchases. Earlier in the year, it guided operating cash flow of about USD 19.0 billion and capex of about USD 9.0 billion, which it reiterated on its latest earnings call. That implies free cash flow of around USD 10.0 billion, enough to cover buybacks but not buybacks and dividends combined, so part of this year’s shareholder returns will again be funded by debt and the USD 1.2 billion sale of its A+E stake. To cover this and its maturing debt, Disney has said it may draw on cash balances, operating cash flow, commercial paper (backed by USD 12.25 billion of undrawn bank facilities) and new term debt.
For bondholders, this is a key risk that should be monitored going forward, as debt-funded shareholder returns could push leverage higher if earnings growth slows.
Table 1: Trailing-Twelve Months Free Cash Flow (end 3QFY2025 vs end 3QFY2026)
|
|
TTM (ended June 2025) |
TTM (ended June 2026) |
YoY Change |
|
Net Cash from Operations (USD millions) |
19,145 |
16,989 |
-11.3% |
|
Purchase of PPE (USD millions) |
7,597 |
8,696 |
+14.5% |
|
Free Cash Flow (USD millions) |
11,548 |
8,293 |
-28.2% |
|
Data as of 30 June 2026 Source: Company Financials |
|||
Leverage Edges Up, but Debt Servicing Strengthens
As shown in Table 2, total debt rose 8.9% YoY to USD46.0 billion, outpacing the 4.1% growth in total assets, so total debt-to-total assets edged up from 21.5% to 22.5%. The increase came mainly from USD 4.0 billion of new US dollar notes issued in February 2026, a USD 1.1 billion cruise ship loan for the Disney Destiny and USD 2.3 billion of net commercial paper, partly offset by USD 3.6 billion of repayments. Within this, borrowings due within the next 12 months jumped 50.5% YoY to USD 8.6 billion, above cash of USD 5.2 billion, raising near-term refinancing needs. However, adding its USD 12.25 billion of undrawn bank facilities to cash gives total liquidity of about USD 17.4 billion, covering short-term debt 2.0x.
With cash slipping 3.4% YoY to USD 5.2 billion, net debt rose a faster 10.7% to USD 40.9 billion. Equity grew only 2.7% YoY to USD 116.8 billion, held back by USD 7.2 billion of buybacks over the nine months, so net debt-to-total equity rose to 35.0%. While both ratios remain moderate, they show leverage drifting higher as debt grows faster than the asset and equity base.
Table 2: Balance Sheet and Leverage (3QFY2025 vs 3QFY2026)
|
|
3QFY2025 |
3QFY2026 |
YoY Change (%) |
|
Total Debt [1] (USD millions) |
42,263 |
46,041 |
+8.9% |
|
Total Assets [2] (USD millions) |
196,612 |
204,740 |
+4.1% |
|
Total Debt / Total Assets [1/2] (%) |
21.50 |
22.49 |
+1.0pp* |
|
Cash and Equivalents [3] (USD millions) |
5,367 |
5,185 |
-3.4% |
|
Net Debt [4, 1-3=4] (USD millions) |
36,896 |
40,856 |
+10.7% |
|
Total Equity [5] (USD millions) |
113,756 |
116,842 |
+2.7% |
|
Net Debt / Total Equity [4/5] (%) |
32.43 |
34.97 |
+2.5pp |
|
Data as of 30 June 2026 Source:
Company Financials |
|||
Disney’s TTM EBITDA grew 3.6% YoY to USD 23.8 billion, slower than the rise in debt (see Table 3). As a result, total debt-to-EBITDA edged up from 1.8x to 1.9x, which remains relatively comfortable for its A ratings.
Meanwhile, TTM gross interest expense fell 6.9% YoY to USD 1.8 billion, as lower average interest rates more than offset the higher debt balance, lifting interest coverage from 11.9x to 13.2x. This is well above the 3x minimum required under Disney’s bank facility covenant.
During Disney’s latest earnings call, CFO Hugh Johnston said the company is “not really looking to build cash” and is “not looking to delever the balance sheet meaningfully from here”, as it is comfortable with its current leverage. For bondholders, this means leverage is unlikely to fall, leaving less of a buffer if earnings growth slows.
Overall, Disney’s credit profile remains solid for its A ratings, with interest coverage of 13.2x and ample liquidity, though leverage is drifting higher as buybacks are increasingly funded with debt.
Table 3: Debt Servicing (Trailing Twelve Months, end 3QFY2025 vs end 3QFY2026)
|
TTM (ended June 2025) |
TTM (ended June 2026) |
YoY Change (%) |
|
|
Total Debt [1] (USD millions) |
42,263 |
46,041 |
+8.9% |
|
EBITDA [2] (USD millions) |
22,943 |
23,767 |
+3.6% |
|
Total Debt / EBITDA [1/2] (x) |
1.84 |
1.94 |
+0.1x |
|
Gross Interest Expense [3] (USD millions) |
1,928 |
1,795 |
-6.9% |
|
Interest Coverage Ratio [2/3] (x) |
11.90 |
13.24 |
+1.3x |
|
Data as of 30 June 2026 Source: Company Financials |
|||
Bond Recommendation
Disney’s US dollar bonds currently yield between 5.00% and 5.59%, offering a pickup of 47 bps to 78 bps over US Treasuries of similar tenor (see Table 4). The pickup is broadly flat at the short end, at 50 bps on the 2028 bond and 47 bps on the 2031 bond, before widening to 78 bps on the 2034 bond and 64 bps on the 2036 bond.
Against peers, Disney offers slightly more than Netflix at the short end. The DIS 7.280% 30Jun2028, rated A / A2 / - (S&P / Moody’s / Fitch), yields 5.00%, a 14 bps pickup over the similarly rated NFLX 4.875% 15Apr2028 at 4.86%. The CMCSA 3.550% 01May2028, rated a notch lower at A- / A3 / A-, yields 5.14%, 14 bps more than Disney, in line with its weaker credit rating. In contrast, the SKYD 3.700% 01Jun2028 (B+ / B2 / BB-) yields 6.65%, 165 bps more than Disney, to compensate for its sub-investment-grade credit risk.
In the 3–5-year space, the DIS 2.650% 13Jan2031, with 4.2 years to maturity, yields 5.13%. This is 44 bps less than the CMCSA 1.500% 15Feb2031 at 5.57% and 422 bps less than the SKYD 4.950% 15Jan2031 at 9.35%. Both gaps are expected given Disney’s stronger credit rating: Comcast is rated a notch lower at A- / A3 / A-, while Paramount Skydance’s B+ / B2 / BB- ratings put it well into sub-investment-grade territory, so investors demand a much higher yield.
Further out, Disney trades broadly in line with Netflix and tighter than Comcast. The DIS 8.450% 01Aug2034 yields 5.59%, just 7 bps more than the NFLX 4.900% 15Aug2034 at 5.52%, and 41 bps less than the CMCSA 5.300% 01Jun2034 at 6.00%. The DIS 8.150% 17Oct2036 yields 5.55%, 16 bps less than the NFLX 5.250% 15Aug2036 at 5.71% and 57 bps less than the CMCSA 3.200% 15Jul2036 at 6.12%. Comcast’s wider gap is more than a one-notch rating difference would usually explain, likely reflecting pressure on its broadband business. Against Paramount Skydance, which is taking on substantial debt to fund its acquisition of Warner Bros. Discovery, Disney yields considerably less: 764 bps below the SKYD 4.850% 15Dec2034 (13.23%) and 415 bps below the SKYD 9.125% 15Oct2036 (9.70%).
Overall, we view Disney’s bonds as fairly priced. Yields are in line with the similarly rated Netflix and below the lower-rated Comcast, so investors are paying for a solid A-rated credit rather than receiving extra compensation relative to peers. Investors may consider the DIS 7.280% 30Jun2028, which offers the best value against its same-rated peer. Its short 1.7-year tenor also limits exposure to the risk of Disney’s leverage creeping higher as buybacks are increasingly funded with debt. Investors should monitor leverage at the upcoming 4QFY2026 results.
For investors seeking higher yields from the media sector who are comfortable with BB-rated credit, the SKYD 9.125% 15Oct2036 (BB / B1 / BB) yields 9.70%. As a secured bond, it ranks ahead of Paramount Skydance’s unsecured debt in a default. However, investors should be mindful of its weaker credit quality. The company is taking on substantial debt to fund its acquisition of Warner Bros. Discovery, faces integration risks, and remains exposed to the structural decline of traditional TV. The bond is also callable from October 2031, so investors may not earn this yield for the full ten years if it is redeemed early.
Table 4: Peer Comparison
|
Issuer |
Issue |
Ask Price |
Yield to Worst (%) |
Call / Maturity Date (Years to Call / Maturity) |
Credit Ratings |
|
The Walt Disney Company |
DIS 7.280% 30Jun2028 Corp (USD) |
103.56 |
5.00 |
- / 30 Jun 2028 ( - / 1.7) |
A / A2 / - |
|
The Walt Disney Company |
DIS 2.650% 13Jan2031 Corp (USD) |
90.75 |
5.13 |
- / 13 Jan 2031 ( - / 4.2) |
A / A2 / - |
|
The Walt Disney Company |
DIS 8.450% 01Aug2034 Corp (USD) |
117.74 |
5.59 |
- / 01 Aug 2034 ( - / 7.8) |
A / A2 / - |
|
The Walt Disney Company |
DIS 8.150% 17Oct2036 Corp (USD) |
119.69 |
5.55 |
- / 17 Oct 2036 ( - / 10.0) |
A / A2 / - |
|
Comcast Corp |
CMCSA 3.550% 01May2028 Corp (USD) |
97.75 |
5.14 |
01 Feb 2028 / 01 May 2028 (1.2 / 1.5) |
A- / A3 / A- |
|
Comcast Corp |
CMCSA 1.500% 15Feb2031 Corp (USD) |
84.69 |
5.57 |
15 Nov 2030 / 15 Feb 2031 (4.0 / 4.3) |
A- / A3 / A- |
|
Comcast Corp |
CMCSA 5.300% 01Jun2034 Corp (USD) |
95.77 |
6.00 |
01 Mar 2034 / 01 Jun 2034 (7.3 / 7.6) |
A- / A3 / A- |
|
Comcast Corp |
CMCSA 3.200% 15Jul2036 Corp (USD) |
78.87 |
6.12 |
15 Jan 2036 / 15 Jul 2036 (9.2 / 9.7) |
A- / A3 / A- |
|
Netflix Inc |
100.01 |
4.86 |
- / 15 Apr 2028 ( - / 1.5) |
A / A2 / - |
|
|
Netflix Inc |
96.13 |
5.52 |
15 May 2034 / 15 Aug 2034 (7.5 / 7.8) |
A / A2 / - |
|
|
Netflix Inc |
NFLX 5.250% 15Aug2036 Corp (USD) |
96.59 |
5.71 |
15 May 2036 / 15 Aug 2036 (9.5 / 9.8) |
A / A2 / - |
|
Paramount Skydance |
SKYD 3.700% 01Jun2028 Corp (USD) |
95.65 |
6.65 |
01 mar 2028 / 01 Jun 2028 (1.3 / 1.6) |
B+ / B2 / BB- |
|
Paramount Skydance |
85.01 |
9.35 |
15 Oct 2030 / 15 Jan 2031 (4.0 / 4.2) |
B+ / B2 / BB- |
|
|
Paramount Skydance |
SKYD 4.850% 15Dec2034 Corp (USD) |
59.04 |
13.23 |
15 Jun 2034 / 15 Dec 2034 (7.6 / 8.1) |
B+ / B2 / BB- |
|
Paramount Skydance |
SKYD 9.125% 15Oct2036 Corp (USD) |
96.41 |
9.70 |
15 Oct 2031 / 15 Oct 2036 (5.0 / 10.0) |
BB / B1 / BB |
|
Data as of 4 November 2026 Source: Bloomberg and Bondsupermart |
|||||
Declaration: For specific disclosure, at the time of publication of this report, IFPL (via its connected and associated entities) holds positions in SKYD 4.950% 15Jan2031 Corp (USD). The analyst who produced this report holds NIL positions in the abovementioned securities. This research report was prepared with the assistance of artificial intelligence (AI) tools. iFAST Financial Pte Ltd does not rely exclusively on AI for content generation; the content of this report – including all investment theses, ratings, price targets and conclusions – has been independently reviewed and verified by the research analyst(s) to ensure accuracy and professional integrity.