Energie Baden-Württemberg AG, better known as EnBW, is one of Germany's largest energy companies. It is headquartered in Karlsruhe, in the southwestern state of Baden-Württemberg and was formed in 1997 through the merger of two regional power utilities. Today it employs roughly 30,000 people and serves customers across Germany and other parts of Europe.
Its business model is simple: EnBW earns money at every stage of delivering energy. It generates electricity, owns the power and gas grids that carry it, and sells electricity and gas to households, businesses and local authorities.
Chart 1: Germany’s four transmission system operator (TSO) control areas/ transmission grid
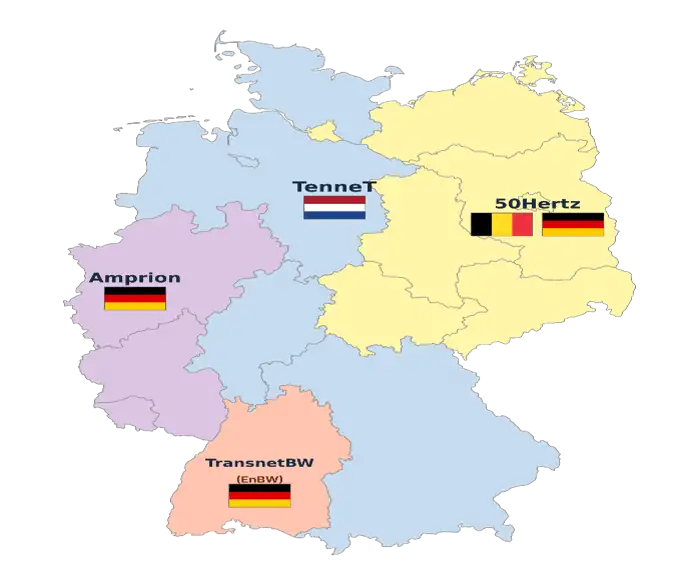
Source: EnBW, Data as of 30 June 2026
Driven by EU rules separating power generation from grid control, Germany’s main utilities split off their high-voltage networks in 2010. E.ON and Vattenfall sold their grid divisions to foreign operators, Dutch-owned TenneT and Belgium's Elia (50Hertz), while RWE spun Amprion off to private investors.
EnBW instead used an EU legal option called the Independent Transmission Operator (ITO) model, which allowed it to keep ownership by setting up its grid division as a strictly independent, firewalled subsidiary. As a result, Baden-Württemberg remains the only German transmission zone still owned by its founding utility.
Its installed generation capacity is roughly 13 gigawatts, of which around 8 gigawatts is renewable (mainly wind, solar and hydro) and the remainder thermal, largely gas, coal and waste to energy plants. The regulated grid business provides the steady income that helps fund heavy spending on renewables, network upgrades and fast charging for electric vehicles.
Although EnBW is a listed company, it is not really owned by ordinary investors on the stock market. Almost all of it sits in public hands: the state of Baden-Württemberg and OEW (an association of nine Swabian districts) each hold about 47% of the shares following a capital increase in July 2025. In practice, that makes EnBW a business backed by the state and by local councils, which gives it very stable ownership and a strong regional focus.
EnBW – Operating Segments
EnBW operates mainly across three segments, namely:
Table 1: Operating segments
|
Segment |
What it does |
Pricing power |
Sensitivity to electricity price |
|
System Critical Infrastructure |
-
Transmission grid for electricity and gas |
None — regulated return set by Bundesnetzagentur (Germany's federal network regulator) |
Low — regulated revenue, largely insulated from price swings |
|
Sustainable Generation Infrastructure |
-
Power generation |
None — EnBW must accept whatever price the market is offering at the time; it can't charge its own price like a retailer would (though its renewables output is partly de-risked via long-term PPAs) |
High — revenue and cost of materials both move directly with wholesale power/gas prices |
|
Smart Infrastructure for Customers |
-
Sales of electricity and gas |
Some — sets retail tariffs and charging prices, limited by competition |
Moderate — margins can compress/expand short-term if procurement costs and tariff resets are out of sync |
Source: Company Reports, iFAST Compilations. Data as of 30 June 2026
Financials highlights
As shown in Table 1, the revenue is declining for the period 2023-2025, from €44,431m to €34,390m, primarily driven by the energy price normalisation instead of business deterioration, following the volatile electricity prices seen in 2022 due to the Russia-Ukraine war.
In FY2025, the lower earnings before tax was mainly due to a write-off on a UK offshore wind investment (Mona and Morgan) as they failed to secure a Contract for Difference (CfD) – the UK government’s subsidy scheme that guarantees a fixed electricity price. Without this, the projects would have to sell power at whatever the market price happens to be (meaning more exposure to downside risk).
In 1HFY26, revenue rose by 9.3% YoY to €19,132m as a result of mixed performance across its operating segments. Out of the 3 segments, System Critical Infrastructure and Sustainable Generation Infrastructure recorded higher revenue, mainly because of higher grid usage revenue in System Critical Infrastructure segment and higher gas and power trading prices in Sustainable Generation Infrastructure segment.
Despite higher revenue, EnBW recorded lower adjusted EBITDA of €2,268m, representing a 6.3% YoY decline. This was primarily due to procurement costs (cost of materials) outpacing revenue growth, as higher gas prices pushed up the cost of materials by €1,504.9m to €15,033m.
In addition, other operating expenses increased by €511.2 million to €1,866.5 million. The company stated that the measurement of derivatives had a primarily negative impact, which further weighed on earnings.
Overall, earnings before tax fell by 23% YoY to €883.5m as the increase in revenue was largely offset by higher costs. Despite the slight decline in adjusted EBITDA, the management has maintained its guidance for adjusted EBITDA to be within the range of €4.6 billion - €5.1 billion for FY2026.
Looking ahead, we believe EnBW’s exposure to commodity price fluctuations should continue to decline as its transition to renewable energy progresses. Low-risk activities, mainly regulated grids and renewables, accounted for 79.1% of adjusted EBITDA in 1H2026 (vs 75.0% in 1H2025), and this share is expected to increase further as the company continues to focus its investments on grids and renewables.
Table 2: Profitability indicators (€ million, unless otherwise stated)
|
2023 |
2024 |
2025 |
1HFY2025 |
1HFY2026 |
|
|
Revenue |
44,431 |
34,524 |
34,390 |
17,498 |
19,132 |
|
Adjusted EBITDA |
6,365 |
4,903 |
5,072 |
2,420 |
2,268 |
|
Earnings before tax (EBT) |
2,841 |
2,692 |
840 |
1,154 |
883 |
|
Adjusted EBITDA Margin (%) |
14.3% |
14.2% |
14.7% |
13.8% |
11.9% |
Source: Company Reports, iFAST Compilations. Data as of 30 June 2026
If we delve deeper into the adjusted EBITDA segmental breakdown, we can see that there was a sharp decline in the Sustainable Generation Infrastructure segment. Despite higher electricity generation from wind and solar, these positive contributions were outweighed by lower hydroelectric output due to low water levels. Moreover, in the thermal generation and trading area, lower adjusted EBITDA was driven by reduced margins on electricity sales and lower trading revenue, compounded by the loss of earnings from lignite and coal generation following the sale of the lignite plant and the transfer of a hard coal plant to grid reserve at the end of 2025, as EnBW transitions to green energy.
Table 3: Breakdown by segment (Adjusted EBITDA, € million)
| Operating Segment | 1HFY2025 (Contribution to Group EBITDA, %) |
1HFY2026 (Contribution to Group EBITDA, %) |
YoY Change in % |
| Sustainable Generation Infrastructure | 1081.3 (42%) |
805.8 (33%) |
-25.5% |
| System Critical Infrastructure | 1289.6 (50%) |
1298.1 (54%) |
0.7% |
| Smart Infrastructure for Customers | 233 (9%) |
309.399 (13%) |
32.7% |
Source: Company Reports, iFAST Compilations. Data as of 30 June 2026
*** System Critical Infrastructure segment benefits from relatively stable earnings, supported by its regulated electricity and gas grid businesses. Under Germany's regulatory framework, grid operators benefit from allowed returns (returns permitted by the regulator on their grid investments), providing greater earnings visibility. According to EnBW's 2025 Factbook, the weighted allowed returns stood at 3.48% for existing electricity grids and 3.70% for existing gas grids, while new grid investments offered a higher weighted allowed return of approximately 5.30% in 2025. The current regulatory periods for gas and electricity grids will end in 2027 and 2028 respectively, after which the returns will be subject to revised regulatory arrangements.
Credit profile
EnBW’s FFO (Funds from Operations) to Net Debt ratio, which measures the company’s ability to cover its debt using operational cash flow (excluding changes in working capital), fell sharply from 53% in 2023 to a low of 22% in 2024, before partially recovering to 27% in 2025 and settling at 26% in 1HFY2026. We view that this is reasonable for a capital-intensive company, as the high CAPEX and elevated borrowing levels have compressed the ratio.
On gearing, the net debt to equity ratio held steady at 71% in 1HFY2026, unchanged from FY2025 and an improvement from the peak of 78% in 2024, although still higher than the 66% recorded in 2023. The stabilisation came largely from the equity side rather than debt reduction, as the €3.1 billion capital increase completed in July 2025 by Baden-Württemberg and OEW (via rights issue) has expanded the equity base. Overall, borrowing levels have remained stable since 2024 at around €19,500 million.
On the liquidity side, we don’t see much concern considering that EnBW is able to meet its short-term debt obligations comfortably with its current cash levels of around €4,036 million against its short-term debt of €1,426 million. Furthermore, EnBW has around €7.6 billion of unutilised bank credit lines as of 30 June 2026, providing ample buffer against its debt obligations.
To summarise, we view that the credit risk remains very minimal, supported by the solid liquidity position and ample liquidity buffer, although borrowing is likely to stay elevated as the heavy CAPEX programme continues to be partly debt funded (~ €7 billion a year through 2030).
Table 4: Credit metrics
|
in € million |
2023 |
2024 |
2025 |
1HFY2026 |
|
Cash and cash equivalents |
5,995 |
5,682 |
4,330 |
4,036 |
|
Short-term debt |
1,464 |
2,047 |
2,126 |
1,426 |
|
Long-term debt |
15,004 |
17,458 |
17,686 |
18,013 |
|
Operating Cash Flow (after changes in working capital) |
900 |
2,715 |
4,528 |
1,713 |
|
LTM FFO to Net Debt ratio (%) |
53% |
22% |
27% |
26% |
|
Net debt to equity ratio (%) |
66% |
78% |
71% |
71% |
|
Interest coverage ratio (x) TTM |
4.5 |
4.1 |
3.7 |
4.1 |
Source: Company Reports, iFAST Compilations. Data as of 30 June 2026
Although borrowings remain elevated, EnBW's well-spread bond maturity profile provides additional comfort. As shown in Chart 1, approximately €1.5–2.0 billion of outstanding bonds are scheduled to mature annually over the coming years, which we believe remains well within the company's ability to service.
Chart 2: Debt maturity profile (bonds only - € billion)
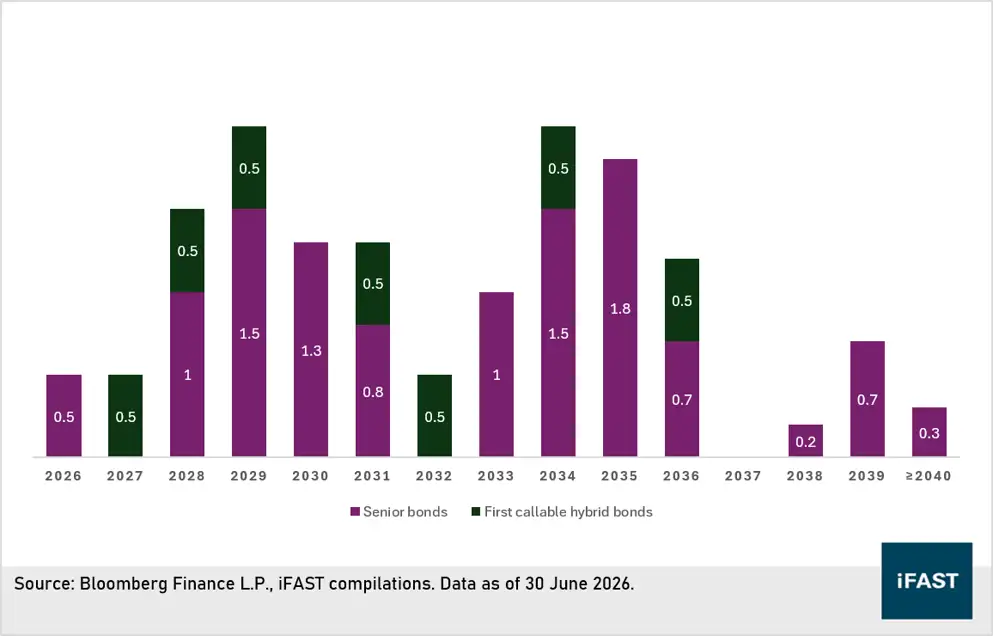
Borrowing is expected to stay elevated considering higher CAPEX requirements until 2030
The management has provided guidance as part of their ongoing expansion strategy as follows:
1) Overall: Up to €50bn gross investment 2024-2030 (60-70% grids, 25-30% generation, 5-10% customer solutions), ~€7bn/year in 2026-2027.
2) Sustainable Generation Infrastructure: 10-11.5 GW renewable capacity by 2030, 75-80% of generation from renewables (current: ~7.3GW, 66%), coal-free by end-2028.
3) System Critical Infrastructure: Regulated Asset Base growing to ~€35bn by 2030, driven by SuedLink, ULTRANET, and hydrogen network expansion.
4) Smart Infrastructure for Customers: Up to 20,000 fast-charging points (Current: >9,000) by 2030 (~20% German market share).
Risks
Counterparty Risk – As mentioned, most of EnBW’s upcoming renewable generation projects will operate under long-term contracts (PPAs). This structure exposes the company to counterparty risk, in the event that a buyer of electricity defaults or becomes insolvent before the contract term ends.
Nevertheless, at this juncture, we believe that counterparty risk remains relatively low, considering the established profiles of its PPA buyers. For instance, EnBW has secured 15-year PPAs with Google, Evonik (a major German specialty chemicals company), Deutsche Telekom and Bosch for its He Dreiht offshore wind farm. The involvement of these established corporations provides additional comfort regarding the reliability of EnBW's long-term contracted revenue.
High CAPEX – As part of its transition to green energy, EnBW is investing heavily in renewable energy, including the phase-out of existing coal-fired plants and the development of new renewable facilities. Management has indicated that annual gross investment will be around €7 billion a year through 2027, as part of the up to €50 billion programme running to 2030.
Although we believe the credit risk is manageable and EnBW has the ability to service the higher CAPEX, investors should stay mindful and monitor the company’s performance closely.
Our view
Looking forward, EnBW is likely to continue seeking additional funding as it progresses through its transition to renewable energy, given the higher CAPEX and investment costs required. That said, we believe the credit risk should remain manageable considering the resilient earnings performance and solid liquidity profile, further underpinned by the company’s ownership (~95% owned by the state government and related associations). This implies the company is likely to receive support from these stakeholders when necessary.
In summary, we continue to maintain a positive view on EnBW. Considering Australia's macroeconomic outlook, we advocate investors adopting a barbell strategy when investing in AUD-denominated bonds. With this in mind, investors may consider ENBW 6.048% 30Oct2034 Corp (AUD) and ENBW 5.7923% 26Feb2036 Corp (AUD), offering YTMs of 6.36% and 6.52% respectively.
Table 5: Recommended Bonds
|
Bond |
Years to maturity |
Yield to call maturity |
Min / Sub |
|
2Y11M |
5.69% |
AUD 10k / 10k |
|
|
5Y0M |
6.00% |
AUD 200k / 10k |
|
|
7Y11M |
6.36% |
AUD 10k / 10k |
|
|
9Y3M |
6.52% |
AUD 200k / 10k |
Source: BSM, iFAST Compilations. Data as of 03 November 2026
Declaration: For specific disclosure, at the time of publication of this report, IFPL (via its connected and associated entities) and the analyst who produced this report hold a NIL position in the abovementioned securities.