
- Aggregate leverage rose to 39.7% as at 30 September 2026 (30 June 2026: 37.4%), higher than our earlier pro forma estimate of 37.5%, as the June figure was temporarily flattered by the timing of the transactions.
- Property values would now need to fall about 21% before leverage reaches the 50% regulatory limit (previously about 25%), and a 50 bps rise in cap rates would lift leverage to about 44%.
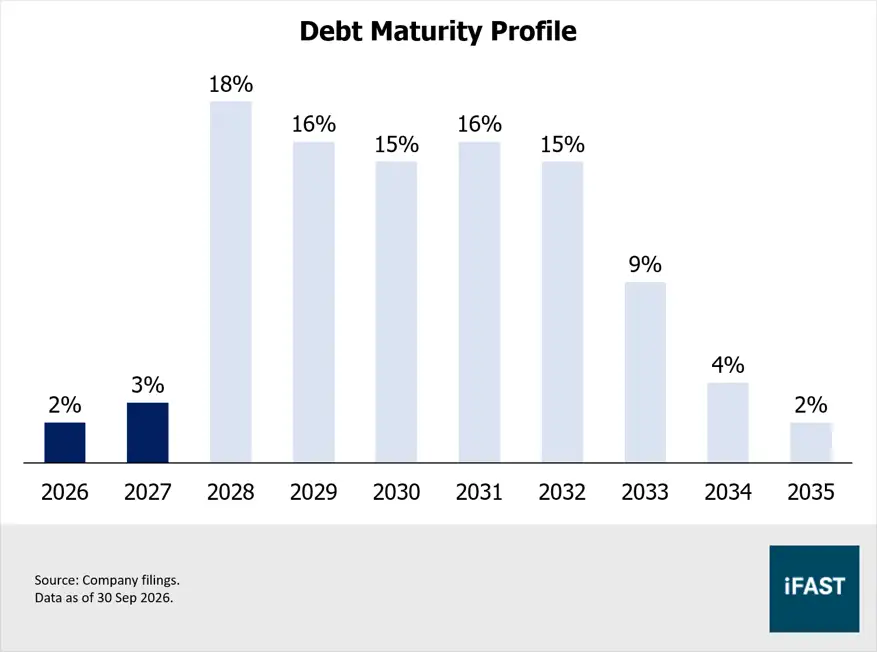
- Interest coverage remains healthy at 3.8 times, while average cost of debt fell to 2.8% and only about 5% of debt matures in 2026 and 2027.
- Operations remain robust, with 9M26 NPI up 10.4% year-on-year, portfolio occupancy at 96.1% and positive rental reversions of 7.1% for office and 4.6% for retail.
- S-REIT bond spreads over SGS have widened since our last credit update, as REIT bond yields edged up while longer-dated SGS yields fell. CICT's bonds now yield about 22 to 81 bps over SGS of similar tenor.
In our previous credit update, we concluded that CICT's credit buffers were ample but that its SGD bonds already reflected its credit quality. CICT has since completed the divestment of Asia Square Tower 2 (AST2) on 17 September 2026 and released its business update for the third quarter ended 30 September 2026 ("3Q26"). With the asset swap now reflected in its balance sheet, we revisit our stress test and bond valuations.
Related article: Credit Update: CICT's credit buffers are ample, but its bonds already reflect it
3Q26 Business Highlights
CICT's net property income (NPI) rose 13.8% year-on-year (YoY) to SGD 334.9 million in 3Q26, and 10.4% YoY to SGD 965.4 million for the nine months ended 30 September 2026 ("9M26"). Growth was driven by contributions from Paragon, Gallileo and the step-up acquisition of CapitaSpring, partially offset by the divestments of Bukit Panjang Plaza and AST2.
Committed portfolio occupancy improved to 96.1% as at 30 September 2026 (30 June 2026: 95.6%), with office at 95.4%, integrated developments at 96.4% and retail at 97.3%. 9M26 rental reversions were positive at 7.1% for office and 4.6% for retail, and management expects mid-single-digit reversions for both portfolios through 2027. Retail momentum remains softer: excluding Paragon, 9M26 shopper traffic rose only 0.9% YoY and tenant sales psf rose 2.0% YoY.
Why did leverage rise?
CICT's aggregate leverage rose to 39.7% as at 30 September 2026, from 37.4% as at 30 June 2026. Total borrowings, including its share of joint venture borrowings, increased from about SGD 10.7 billion to SGD 11.9 billion.
Based on our estimates, the increase is consistent with how the asset swap was funded rather than a deterioration in the operating performance. In April 2026, CICT temporarily used SGD 555 million of its SGD 750 million private placement proceeds to repay debt, which lowered leverage as at 30 June. When Paragon completed on 1 July, the total acquisition outlay of about SGD 3.9 billion was funded by drawing down debt again, the placement proceeds and, after 17 September, the net AST2 sale proceeds of about SGD 2.45 billion. The resulting net increase of about SGD 1.2 billion in borrowings, against a net increase of about SGD 1.4 billion in property assets, explains most of the rise in leverage.
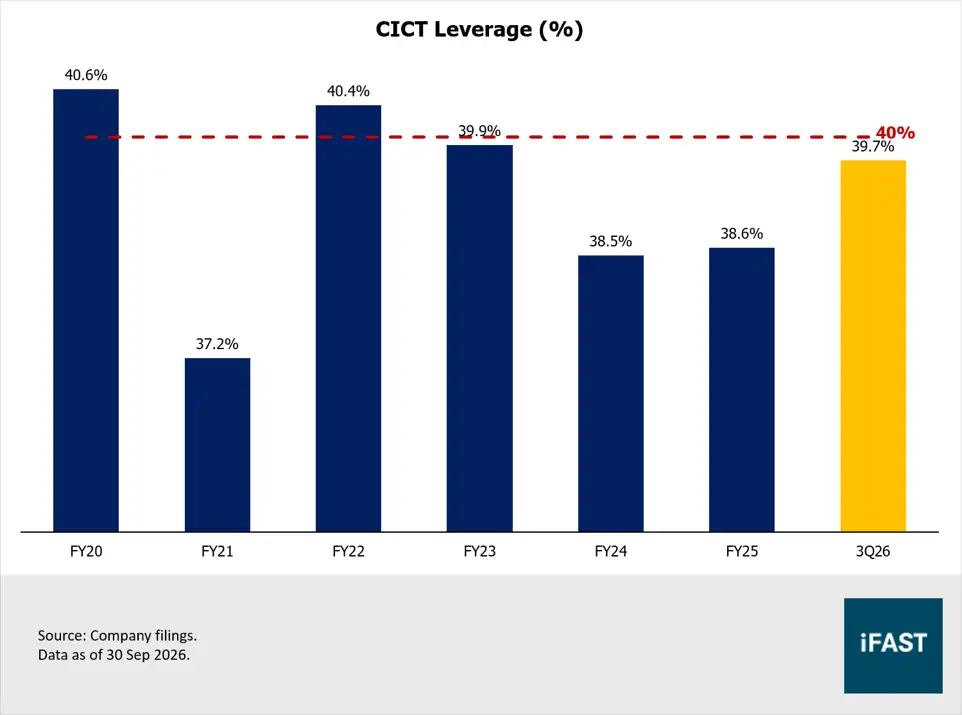
We therefore view leverage of around 40% as CICT's new baseline after the asset swap, rather than a temporary spike. This is slightly above the 38.7% pro forma figure in CICT's EGM circular, which was based on 31 December 2025 numbers, and above our earlier estimate of 37.5%. CICT now sits just below our 40% screening threshold for S-REITs.
We use this threshold as a guide rather than a hard limit, and a modest move above it would not on its own change our view. CICT has operated around this level before: aggregate leverage reached 40.6% in FY20, amidst the pandemic and its merger with CapitaLand Commercial Trust, and 40.4% in FY22 as interest rates rose. In both cases it fell back below 40% within a year or two (Figure 1).
Figure 1: CICT’s leverage over recent years
Revisiting our stress test
At 39.7% leverage and SGD 11.9 billion of borrowings, we estimate that the value of CICT's deposited properties would need to fall by about SGD 6.1 billion, or about 21%, before leverage reaches the 50% MAS regulatory limit, compared with about 25% in our previous update.
Applying the cap rate stress test, updated to a cap rate of 4.3% (based on 9M NPI) and unchanged borrowings, a 50 bps rise in cap rates would now lift leverage to about 44.3%, while a 100 bps rise would take it to about 48.9% (Table 1). In our view, the more realistic 25 to 50 bps scenario still leaves CICT comfortably within the regulatory limit, but the severe 100 bps scenario now brings leverage uncomfortably close to it.
Table 1: Illustrative leverage under higher cap rates
|
Cap rate expansion |
Implied fall in property values |
Implied leverage (previous update) |
Implied leverage (30 Sep 2026) |
|
Current |
- |
37.5% |
39.7% |
|
+25 bps |
5.5% |
39.6% |
42.0% |
|
+50 bps |
10.4% |
41.7% |
44.3% |
|
+75 bps |
14.8% |
43.8% |
46.6% |
|
+100 bps |
18.8% |
46.0% |
48.9% |
|
Source: Company filings, iFAST estimates. Assumes a cap rate of 4.3%, based on CICT's implied portfolio NPI yield, and unchanged borrowings of about SGD 11.9 billion, including share of joint venture borrowings. |
|||
Interest coverage and debt profile remain strong
Other credit metrics were largely stable (Table 2). CICT's interest coverage ratio (ICR) eased slightly to 3.8 times from 3.9 times, while average cost of debt fell to 2.8%, helped by the issuance of SGD 400 million of 2.646% green notes due 2031 in September 2026.
In our view, part of the lower cost may also reflect floating-rate acquisition financing drawn for Paragon, as the share of fixed-rate borrowings dipped to 76% from 78%, and this benefit may not fully persist as these facilities are refinanced. Nevertheless, with fixed-rate borrowings within its 70% to 80% target range, CICT remains well protected against near-term interest rate volatility.
Based on our stress test on the ICR, we expect it to be at 2.9 times if interest rates rose 100 bps (consistent with CICT’s sensitivity analysis), well above the MAS minimum of 1.5 times.
Table 2: CICT's key credit metrics
|
Metric |
30 Jun 2026 |
30 Sep 2026 |
|
Aggregate leverage |
37.4% |
39.7% |
|
Total borrowings incl. JV share (SGD billion) |
10.7 |
11.9 |
|
Interest coverage ratio |
3.9x |
3.8x |
|
Average cost of debt |
2.9% |
2.8% |
|
Fixed-rate borrowings |
78% |
76% |
|
Average term to maturity |
4.1 years |
4.2 years |
|
Unencumbered assets (% of total assets) |
92.8% |
93.1% |
|
Source: Company filings, iFAST compilations. Data as at the dates shown. |
||
Refinancing risk remains low. Average debt maturity lengthened to 4.2 years, and only about 5% of debt matures in 2026 and 2027 (Figure 2). Issuer ratings are unchanged at A3 (Moody's) and A- (S&P).
Figure 2: Only about 5% of CICT's debt matures before 2028
CICT Bonds
Table 3: CICT's SGD bonds
|
Bond |
Yield to Maturity |
Years to Maturity |
Spread over SGS (bps), 18 Nov 2026 |
Spread over SGS (bps), 20 Oct 2026 |
|
2.087% |
0.98 |
22 |
10 |
|
|
2.250% |
1.30 |
35 |
28 |
|
|
2.607% |
3.58 |
58 |
51 |
|
|
2.697% |
4.31 |
65 |
57 |
|
|
2.742% |
4.80 |
68 |
56 |
|
|
2.828% |
5.86 |
72 |
59 |
|
|
2.842% |
6.05 |
73 |
56 |
|
|
3.000% |
7.64 |
81 |
67 |
|
|
3.023% |
8.45 |
80 |
65 |
|
|
Sources: Bondsupermart, MAS, iFAST Compilations. Yields as of 18 November 2026. Spreads are iFAST estimates against SGS yields interpolated from MAS 6-month, 1-, 2-, 5- and 10-year benchmark yields as of 18 November 2026. ^Green bonds. All bonds are non-rated senior unsecured notes issued by CMT MTN Pte Ltd and guaranteed by CICT. |
||||
Between our last update on 20 October and 18 November, CICT's bond yields rose by only about 1 to 8 bps, despite the rise in leverage. Over the same period, longer-dated SGS yields fell, with the 5-year and 10-year SGS yields declining by 11 bps each to 2.07% and 2.29% respectively. As a result, CICT's spreads over SGS widened by about 7 to 17 bps, with the larger increases at the longer end.
This widening was broad-based across S-REIT bonds rather than specific to CICT (Table 4). Leverage also rose across most peers in 3Q26, and CICT retains the highest ICR and the second-lowest leverage in the group after Mapletree Pan Asia Commercial Trust. CICT continues to trade in line with Mapletree Pan Asia Commercial Trust and CapitaLand Ascendas REIT, a similarly rated S-REIT with an industrial focus, in the 3 to 6 year range, while weaker credits such as Suntec REIT and OUE REIT offer about 25 to 50 bps more.
Table 4: CICT versus selected S-REIT bonds
|
Bond |
Yield to Maturity |
Years to Maturity |
Spread over SGS (bps) |
Aggregate leverage |
ICR |
|
2.667% |
3.36 |
65 |
38.1% |
3.3x |
|
|
2.607% |
3.58 |
58 |
39.7% |
3.8x |
|
|
2.606% |
3.77 |
57 |
41.8% |
3.4x |
|
|
2.960% |
4.35 |
91 |
43.0% |
2.3x |
|
|
3.226% |
4.85 |
116 |
42.1% |
2.9x |
|
|
2.830% |
5.77 |
73 |
41.8% |
3.4x |
|
|
2.828% |
5.86 |
72 |
39.7% |
3.8x |
|
|
2.943% |
7.53 |
76 |
41.8% |
3.4x |
|
|
3.075% |
7.30 |
90 |
38.1% |
3.3x |
|
|
3.000% |
7.64 |
81 |
39.7% |
3.8x |
|
|
Sources: Bondsupermart, MAS, company filings, iFAST Compilations. Yields as of 18 November 2026. Leverage and ICR as at 30 September 2026 from each REIT's latest results or business update. CLAR's ICR includes distributions on perpetual securities (3.5x excluding them). |
|||||
Our View
CICT's credit profile remains strong, supported by healthy interest coverage, a long and well-spread debt maturity profile, a largely unencumbered asset base and resilient operations. However, with leverage now near 40%, CICT’s buffer against a sharp fall in valuations is thinner than before.
We maintain our positive view on CICT’s credit profile but will monitor leverage closely. We would review this view if (1) aggregate leverage rises above 40% for two consecutive quarters without a clear plan to reduce it, (2) ICR falls below 3.0 times, or (3) Moody’s or S&P revise CICT’s outlook to negative or downgrade its ratings. Conversely, further divestments or valuation gains that bring leverage back below 39% would ease our concern.
At the short end, the CAPITA 2.880% 10Nov2027 and CAPITA 2.100% 08Mar2028 still offer only about 22 and 35 bps over SGS.
At the longer end, the CAPITA 3.750% 10Jul2034 and CAPITA 3.300% 30Apr2035 now offer about 80 to 81 bps over SGS of similar tenor, which may appeal to investors seeking to lock in yields with a high-quality issuer, though bond prices could decline if rates rise.
Overall, we think CICT’s bonds are fairly priced. For investors seeking diversified exposure to SGD fixed income markets, we continue to favour the Amova Short Term Bond Fund and United SGD Fund.
Key risks include higher refinancing costs, with about 18% of debt maturing in 2028, new office supply from 2028, softer retail spending, and further increases in leverage from acquisitions or development spending, such as the SGD 1.1 billion Hougang Central commercial development.
Declaration: For specific disclosure, at the time of publication of this report, IFPL (via its connected and associated entities) and the analyst who produced this report hold a NIL position in the abovementioned securities.
This research report was prepared with the assistance of artificial intelligence (AI) tools. iFAST Financial Pte Ltd does not rely exclusively on AI for content generation; the content of this report, including all investment theses, ratings, price targets and conclusions, has been independently reviewed and verified by the research analyst(s) to ensure accuracy and professional integrity.