• Another record quarter: Revenue rose 329% YoY to KRW 104.6 trillion, its first quarter above KRW 100 trillion. The operating margin hit a record 80%, and FCF reached KRW 42.1 trillion.
• Capex set to climb, backed by contracts: Long-term agreements (LTAs) with 14 customers now cover over 50% of 2027-2028 capacity. FY26 capex is guided at the high KRW 40 trillion range, and FY27 capex should rise significantly.
• KRW 100 trillion back to shareholders: Management now targets KRW 100 trillion of FY26 returns, largely covered by free cash flow over the past year. Buybacks will now be conducted quarterly.
• Balance sheet keeps strengthening: Net cash rose KRW 29.3 trillion to KRW 98.7 trillion. Borrowings fell to KRW 15.8 trillion, only 0.07x TTM EBITDA.
• About the bonds: We continue to favour the HYUELE 6.375% 17Jan2028 Corp (USD). It matures before the bulk of new industry capacity arrives in 2028–29.
In August 2026, we initiated coverage on SK Hynix, highlighting how record AI memory profits had turned it into a net cash company. We flagged capex and the then-pending shareholder return framework as the two things to watch. SK Hynix has since released its 3Q26 results (ending 30 September 2026). Here, we focus on the new return plan, confirmed capex and the management commentary.
Throughout, free cash flow (FCF) is operating cash flow (OCF) less capital expenditure (capex); TTM represents trailing twelve months, and YoY is year-on-year.
Related article: Idea of the Week: AI-memory boom fortifies SK Hynix’s 4.66% short-term USD bonds
3Q26: Revenue crosses KRW 100 trillion as margins set yet another record
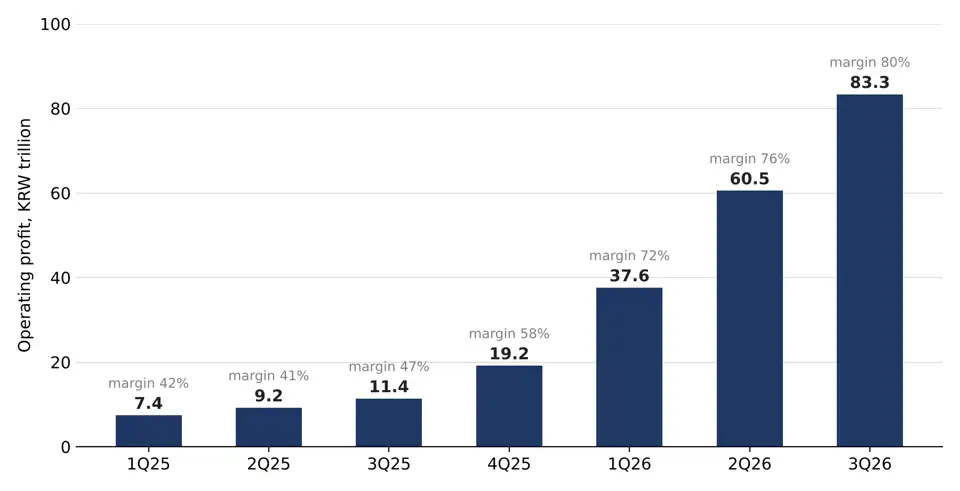
For 3Q26, revenue rose 329% YoY to KRW 104.6 trillion (3Q25: KRW 24.4 trillion). Operating profit jumped 632% YoY to KRW 83.3 trillion, lifting the operating margin to a record 80% (see Chart 1 below). In turn, EBITDA rose 486% YoY to KRW 87.7 trillion, an 84% margin.
DRAM bit shipments rose about 10% QoQ, in line with the guidance we cited at initiation, while average selling prices (ASP) rose in the high-20% range. Full-scale HBM4 shipments began, and server DDR5 shipments jumped more than 40% QoQ. NAND ASPs rose in the mid-20% range, although bit shipments slipped slightly against guidance of low-single-digit growth. DRAM (including HBM) now makes up 75% of revenue (2Q26: 73%), with NAND at 24%.
Net profit rose 216% YoY to KRW 39.8 trillion. Strong operating profit generation was softened by KRW 22.9 trillion of valuation losses on investment assets and KRW 11.6 trillion of foreign exchange losses as the won strengthened against the US dollar. These losses show that SK Hynix’s sizeable investment holdings can swing reported earnings. Hence, for credit analysis, we focus on operating profit and EBITDA instead of net income.
Looking ahead, management guided 4Q26 DRAM bit shipments up in the mid-20% range QoQ, as the M15X fab reaches full capacity by year-end. NAND bits are guided up by mid-single digits, and HBM4 should overtake HBM3E in both shipments and revenue. We would qualify this, however. With margins already at 80%, the more useful question for credit is how durable the supply/demand dynamics for memory are.
Chart 1: Operating Profit Has Risen for Six Straight Quarters, With Margins Now at 80%
Source: Company data, iFAST Compilations.
Data as of 30 September 2026.
Management sees demand outrunning supply to 2030, now backed by more long-term agreements
Management expects memory demand to exceed supply through 2030, citing complex leading-edge processes and long fab build times. Achievable 2027-bit demand growth is seen in the mid-20% range for DRAM and the high teens for NAND. On HBM, customers’ volume requests are “more than double” what SK Hynix can supply.
More important for bondholders is the progress on long-term agreements (LTAs). SK Hynix has now signed LTAs with 14 key customers, up from around ten at initiation. These typically run for five years and cover more than 50% of its total capacity for 2027 and 2028. Prices are generally set within agreed ranges that reflect market conditions, and customer deposits act as safeguards. Think of it like a long lease with a floating rent band: the tenant is locked in, but the rent still moves within limits.
Including volumes still under discussion, management described DRAM and HBM as effectively sold out through 2029. We would not overstate this protection, however. Contract terms remain undisclosed, and AI customers may over-order to secure supply. That demand is also pulling forward heavy investment, which we turn to next.
Capex is guided higher in 2027, though management promises to build in stages
Management guided FY26 capex in the high KRW 40 trillion range. With 9M26 capex at about KRW 31.2 trillion, that implies a heavier 4Q26 of roughly KRW 16 trillion to KRW 18 trillion. For FY27, management expects “capex to increase significantly compared to 2026.” No figure was given.
The longer-term pipeline is also firmer. In August 2026, the board approved KRW 54.3 trillion through 2031 for two new fabs. These are the second Yongin fab (KRW 35.2 trillion, for DRAM including HBM) and the M17 fab in Cheongju (KRW 19.1 trillion, for NAND). Yongin’s first fab is due to open its first cleanroom in early 2027. M17 follows in December 2028, and the second Yongin fab in June 2029.
We would stress management’s message on discipline. SK Hynix’s CEO said, “More investment or more fabs does not necessarily mean more supply.” In practice, building shells go up early, while cleanrooms and equipment follow confirmed demand. Management also checks customers’ financial stability and funding capacity, rather than relying on their announced capex plans. Investment will also be managed around the net cash target, which we view positively. That said, the timing risk we flagged at initiation remains, as several of these fabs open in 2028–29, when rivals’ new capacity is also due. This step-up in capex determines how much cash is left for shareholders and the balance sheet.
Free cash flow stays strong, comfortably covering capex
Earnings continue to turn into cash. OCF rose 281% YoY to KRW 54.8 trillion, albeit 17% below 2Q26’s record KRW 65.7 trillion. After capex of KRW 12.7 trillion (3Q25: KRW 5.3 trillion), SK Hynix generated FCF of KRW 42.1 trillion. That is up 362% YoY, though 23% lower QoQ (2Q26: KRW 55.0 trillion) (see Chart 2 below). On a TTM basis, OCF reached KRW 167.9 trillion and FCF KRW 124.4 trillion.
This matters because FCF is now the yardstick for shareholder payouts.
Chart 2: Cash Flows Remain Near Record Levels Despite a QoQ Dip
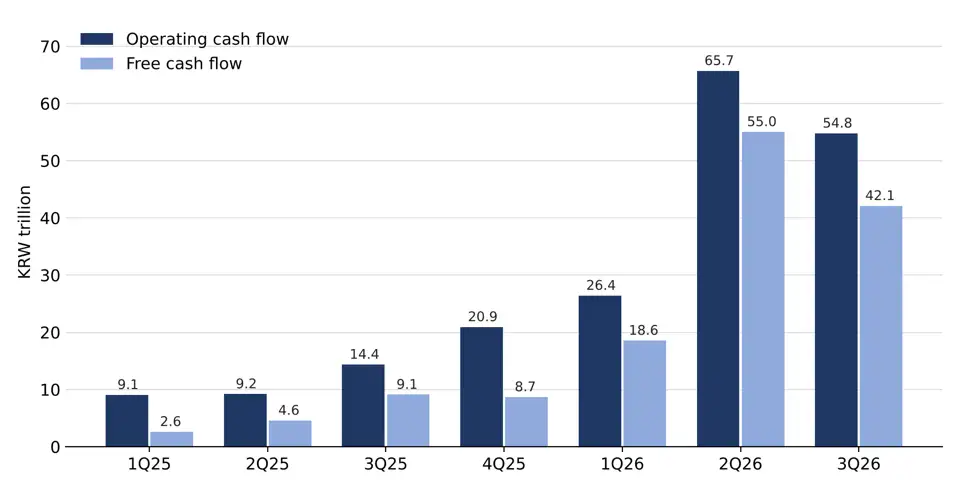
Note: FCF = OCF less purchases of property, plant, equipment and intangible assets.
Source: Company data, iFAST Compilations.
Data as of 30 September 2026.
KRW 100 trillion to shareholders would absorb about 80% of TTM FCF
For FY26, management targets KRW 100 trillion of shareholder returns, up from KRW 40 trillion announced in 2Q26. This comprises at least KRW 30 trillion of cash dividends and at least KRW 60 trillion of buybacks (see Table 1 below). For the remaining KRW 10 trillion, we read this as headroom for further buybacks and the year-end dividend.
About KRW 64 trillion is already committed. This consists of the KRW 14 trillion 3Q26 dividend, the KRW 40 trillion August buyback (completed in late October) and KRW 10 trillion of the new buyback. A separate KRW 10 trillion (not included in the shareholder return plan) is earmarked for employee share compensation.
The 3Q26 dividend of KRW 20,000 per share is split equally between a regular dividend and a special dividend from Kioxia gains. The remaining Kioxia gains will come with the year-end dividend. Going forward, the board will size buybacks each quarter, as management sees the shares as undervalued.
As bondholders, the test is how much FCF these returns consume. TTM FCF is KRW 124.4 trillion; the shareholder returns plan and employee compensation buyback accounts for about 88% of TTM FCF.
That is well above management’s pledge to return “over 50% of free cash flow”. Part of the gap likely comes from the special dividend, which is funded by one-off Kioxia gains rather than operating cash flow.
Crucially for bondholders, the payout is pegged to FCF rather than fixed, so it should shrink in a downturn. Management also pledged to keep “sufficient financial room in light of our medium- to long-term net cash target.”
That said, the cushion is thinner than the headline suggests. About KRW 24 trillion of TTM FCF is left after the KRW 100 trillion shareholder-return plan and KRW 14 trillion after the compensation buyback. The planned rise in FY27 capex will squeeze this further. Even so, we do not think this would worsen SK Hynix’s credit materially, given FCF is expected to be well-supported before additional memory capacity comes online.
Table 1: FY26 Shareholder Returns Would Absorb About 80% of TTM Cash Flow
|
Item |
KRW trillion |
Detail |
|
FY26 shareholder return target |
100 |
Announced 28 Oct 2026; over 50% of FCF |
|
- Cash dividends |
30 or more |
Includes 3Q26 dividend of 14 (KRW 20,000 per share) |
|
- Buybacks |
60 or more |
Includes 40 (completed Oct 2026) and 10 (approved 28 Oct 2026) |
|
Buyback for employee compensation |
10 |
Announced 28 Oct 2026; outside the FY26 target |
|
TTM FCF |
124.4 |
88% used for shareholder return and employee compensation buyback |
|
Source: Company
data, iFAST Compilations. |
||
Net cash reaches KRW 98.7 trillion, keeping leverage concerns limited for now
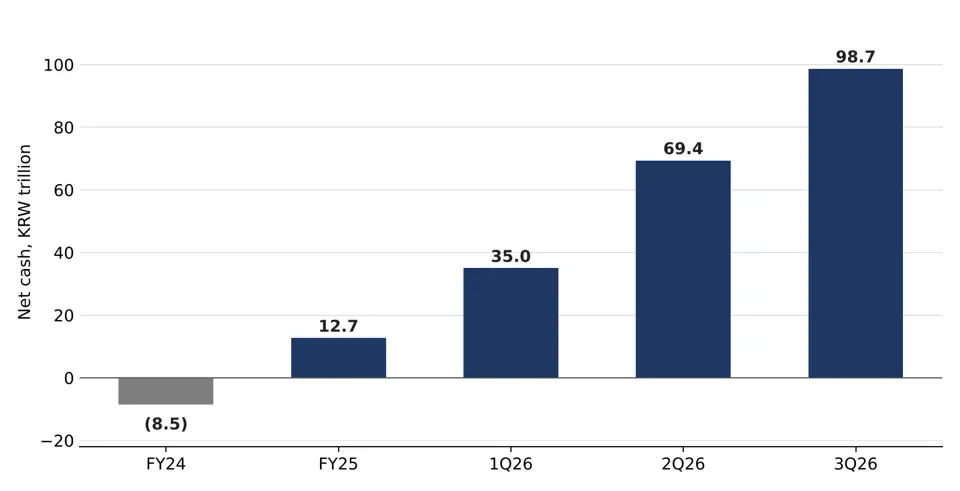
The balance sheet continues to strengthen. Cash and short-term financial instruments rose KRW 26.5 trillion to KRW 114.5 trillion. With borrowings down KRW 2.8 trillion to KRW 15.8 trillion, net cash rose to KRW 98.7 trillion (2Q26: KRW 69.4 trillion) (see Chart 3 below). Borrowings were just 0.07x TTM EBITDA of KRW 216.3 trillion.
As a result, net debt/equity stands at (0.31x), and net debt / TTM EBITDA stands at (0.44x), both improving from 30 June 2026 (see Table 2 below). Since our initiation, S&P upgraded SK Hynix to A- with a positive outlook in August 2026, while Moody’s rates it A3 and Fitch BBB+.
Looking ahead, we expect net cash to keep rising, albeit more slowly as the dividend, new buyback and heavier capex are still to come. Three things would change our view: payouts persistently above FCF, capex that outruns the staged plan, or LTA pricing failing to hold in a downturn.
Chart 3: Net Cash Has Risen Every Quarter, reaching KRW 98.7 Trillion
Source: Company data, iFAST Compilations.
Data as of 30 September 2026.
Table 2: Credit Metrics Keep Strengthening
|
Credit metrics |
FY23 (Dec’23) |
FY24 (Dec’24) |
FY25 (Dec’25) |
1Q26 (Mar’26) |
2Q26 (Jun’26) |
3Q26 (Sep’26) |
|
Net debt / equity* |
0.44x |
0.15x |
(0.08x) |
(0.20x) |
(0.25x) |
(0.31x) |
|
Net debt / TTM EBITDA* |
4.00x |
0.31x |
(0.17x) |
(0.35x) |
(0.47x) |
(0.44x) |
|
* Negative ratios imply a net cash position. Source: Company data, iFAST Compilations. Data as of 30 September 2026. |
||||||
Recommendations: a solid credit, with short tenors still the sweet spot
Overall, we view SK Hynix’s credit profile as solid. The KRW 100 trillion return plan marks a clear tilt towards shareholders. However, it is sized against FCF and comes with a net cash target. Together with KRW 98.7 trillion of net cash and contracted volumes into 2028, we think bondholders remain well protected. The key risks we see are payouts that persistently outrun FCF, a pickup in SK Hynix’s capex against the staged plan, and LTA pricing not providing a cushion in a downturn.
In Table 3 below, we highlight SK Hynix’s USD bonds available on our platform. We continue to favour the HYUELE 6.375% 17Jan2028 Corp (USD). With a little over a year to maturity, it should be repaid before the bulk of new industry capacity arrives in 2028–29. Against comparable US Treasuries, this issue offers a yield spread of 55 bp while offering a yield to worst of 5.50%.
We remain more cautious on the longer-dated bonds, which carry more exposure to that window of new industry capacity coming online. Investors seeking high-quality, short-dated USD income, and who are comfortable with memory-cycle risk, can consider the 2028 issue.
Table 3: SK Hynix’s Outstanding USD Bonds
Issue | Issuer | Ask Price | Yield to Worst (%) | Years to Maturity |
SK Hynix Inc. | 101.24 | 5.50% | 1.17 | |
SK Hynix Inc. | 98.11 | 5.35% | 1.82 | |
SK Hynix Inc. | 95.78 | 5.62% | 3.82 | |
SK Hynix Inc. | 87.99 | 5.65% | 4.18 | |
SK Hynix Inc. | 103.55 | 5.81% | 6.17 | |
Data as of 16 November 2026 Source: Bondsupermart, iFAST Compilations. | ||||
Declaration: For specific disclosure, at the time of publication of this report, IFPL (via its connected and associated entities) holds HYUELE 6.500% 17Jan2033 Corp (USD), and the analyst who produced this report holds NIL positions in the abovementioned securities. This research report was prepared with the assistance of artificial intelligence (AI) tools. iFAST Financial Pte Ltd does not rely exclusively on AI for content generation; the content of this report – including all investment theses, ratings, price targets and conclusions – has been independently reviewed and verified by the research analyst(s) to ensure accuracy and professional integrity.