

Key Points
- Strong earnings growth: Net income rose 9.3% YoY to £14,819m, driven by higher structural hedge income, with NIM improving to 3.21% and statutory profit before tax up 41.6% YoY to £6,625m.
- Improved efficiency: The cost-to-income ratio improved to 49.3% (9MFY2025: 59.7%) as remediation charges fell to £61m from £912m, lifting return on tangible equity to 17.9%.
- Resilient asset quality: The NPL ratio improved to 1.53% (FY2025: 1.71%), while an average mortgage LTV of 45.7% provides a substantial collateral cushion despite normalising impairment charges.
- Solid capital and liquidity: CET1 of 13.3% sits c.130bps above requirements, with Basel 3.1 and a lower Pillar 2A requirement from January 2027 set to boost headroom; LCR and NSFR remain healthy at 143% and 123%.
- Positive stance maintained: Despite UK concentration and a relatively high loan-to-deposit ratio (99%), we remain positive on Lloyds and highlight selected AUD, USD and GBP bonds offering YTCs of 5.04%–7.35%.
Overview
Lloyds Banking Group is one of the UK's largest banking groups, primarily focused on the UK market, serving over 25 million customers through its well-known brands, including Lloyds Bank, Halifax, Bank of Scotland and Scottish Widows. Its core businesses include retail and commercial banking, insurance, pensions and wealth management, with a strong presence in the UK mortgage market.
As of 11 November 2026, Lloyds ranked as the third-largest UK-listed bank by market capitalisation at approximately £55.0 billion, behind HSBC Holdings (the largest, at approximately £229.5 billion) and Barclays (£57.1 billion).
Financial highlights
In its 9MFY2026 earnings report, Lloyds Banking Group (Lloyds) continued to demonstrate a robust earnings profile, with:
· Continue to benefit from higher structural hedge income: In 9MFY2026, Lloyds recorded high-single-digit growth in net income, which increased by 9.3% YoY to £14,819m. This was mainly driven by the bank's continued benefit from higher structural hedge income and growth in average interest-earning assets (+3.7% YoY to £477.5bn), resulting in a 9.7% YoY increase in net interest income to £11,084m. The bank's net interest margin also improved to 3.21% (9MFY2025: 3.04%).
· Growth in other income: This was further supported by stronger customer activity, growth in the UK Motor Finance fleet, a gain from mortgage securitisation and the addition of Lloyds Wealth, with other income increasing by 10.4% YoY to £4,996m.
· Disciplined cost management: Meanwhile, operating costs edged up by only 1.0% YoY to £7,246m, as continued cost savings and lower severance expenses helped offset inflationary pressures. Remediation charges also fell sharply to £61m (9MFY2025: £912m). The 9MFY2026 charge related only to a small number of existing programmes, with no further provision for motor finance commission arrangements. By contrast, the prior-year figure was inflated by an £800m motor finance provision recorded in 3Q2025. As a result, the bank's cost-to-income ratio improved to 49.3% (9MFY2025: 59.7%).
· Normalising impairment charge: The underlying impairment charge rose by 50.5% YoY to £930m, mainly reflecting model updates, retail loan growth, fewer one-off releases in Commercial Banking and an £88m charge arising from a weaker economic outlook due to the Middle East conflict.
· Higher statutory profit before tax: Overall, the bank's statutory profit before tax increased by 41.6% YoY to £6,625m, while statutory profit after tax rose by 45.5% YoY to £4,835m. Return on tangible equity improved to 17.9% (9MFY2025: 11.9%), and Lloyds remains on track to meet its 2026 guidance.
Following the BoE's 25bps rate hike to 4.00% on 5 November 2026, we expect Lloyds' net interest margin (NIM) to remain supported, as the higher interest rate environment allows the bank to reinvest maturing structural hedges at more attractive yields, supporting higher structural hedge income. Meanwhile, the BoE has also indicated the possibility of further rate hikes in the near term should the Middle East conflict persist and continue to exert upward pressure on inflation.
Table 1: Profitability indicators (underlying basis)
|
9MFY2025 |
9MFY2026 |
Change |
|
|
Net income |
13,557 |
14,819 |
9.3% |
|
Operating costs |
(7,176) |
(7,246) |
1.0% |
|
Remediation |
(912) |
(61) |
93.3% |
|
Impairment charge |
(618) |
(930) |
50.5% |
|
Statutory profit before tax |
4,678 |
6,625 |
41.6% |
Source: Company Reports, iFAST compilations. Data as of 30 Sep 2026
Credit highlights
On the credit front, Lloyds' credit profile remained resilient, supported by:
1) Stable asset quality
The asset quality ratio (AQR) remained relatively stable at 0.25% in 9MFY2026, although slightly higher than the 0.17% reported in FY2025. This was primarily due to the 3% growth in the loan portfolio to £495.5 billion, the normalisation of impairment charges from relatively low levels in 2025, and a higher Multiple Economic Scenario (MES)^ charge of £88 million during the period. The MES charge contributed approximately 4–5bps to the AQR, reflecting a weaker economic outlook arising from the Middle East conflict.
^MES is a forward-looking risk model that assesses multiple economic scenarios (e.g. upside, baseline and downside) to determine the level of provisions a bank should set aside for potential future loan losses.
The non-performing loan ratio (Stage 3 loans / gross loans) improved further to 1.53% (FY2025: 1.71%), continuing its steady decline from 2.31% in FY2022. Arrears remained low and stable across all portfolios, supported by a largely secured, mortgage-heavy loan book.
Expected credit loss (ECL) provisions also remained broadly stable, declining marginally to £3,254m (FY2025: £3,353m), mainly due to the derecognition of mortgage assets following a securitisation transaction.
Low provision coverage, but does not necessarily indicate under-provisioning: Stage 3 coverage edged up to 16.8% (FY2025: 15.9%). The relatively low coverage is mainly due to the nature of Lloyds' business, where a significant portion of its loan portfolio (approximately 66%) consists of mortgages, which generally require lower provisions as they are secured by properties. In comparison, unsecured lending portfolios, such as credit cards and personal loans, have a higher coverage ratio of approximately 33%.
Chart 1: Loan Portfolio (as at 30 September 2026)
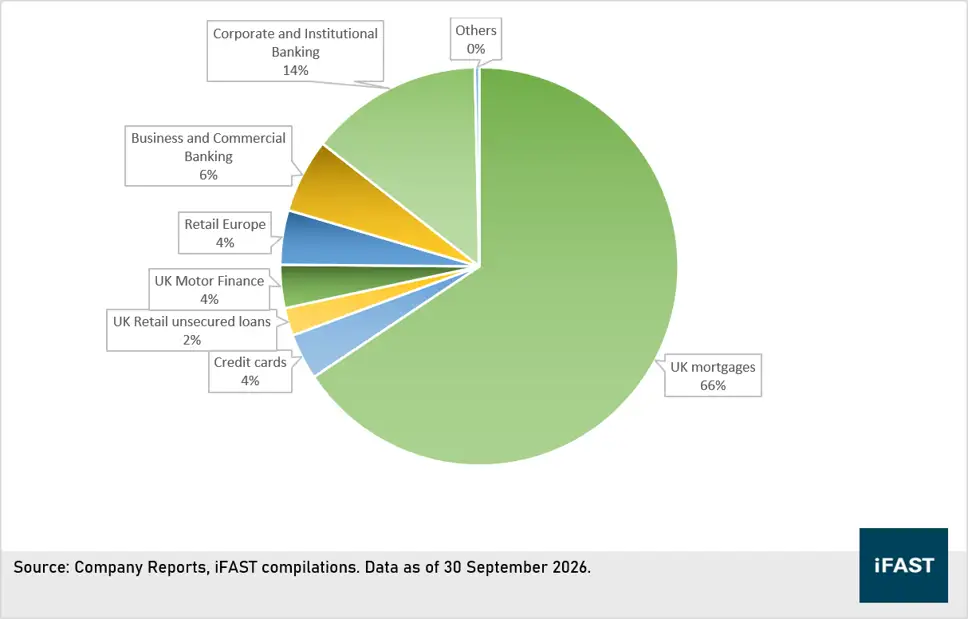
Overall, we continue to believe that borrowers' credit risk remains manageable at this juncture, despite higher inflation arising from ongoing geopolitical uncertainty. This is supported by the decline in Stage 2 and Stage 3 loans to £43,532m and £7,622m, respectively, in 9MFY2026 (FY2025: £45,413m and £8,349m, respectively). Furthermore, the average loan-to-value (LTV) ratio of 45.7% indicates a substantial collateral cushion across Lloyds’ existing mortgage portfolio, helping to mitigate potential credit losses in the event of borrower defaults.
2) Capital buffer remains solid
The CET1 ratio declined to 13.3% (FY2025: 14.0%), mainly due to dividend payments and share buybacks rather than weaker profitability, as the bank generated a strong 153bps of capital during the period. The ratio remains approximately 130bps above its regulatory requirement of c.12%, and Lloyds intends to bring its CET1 ratio down towards its c.13.0% target by end-2026 to optimise returns for shareholders.
Looking ahead, the implementation of Basel 3.1 and a lower Pillar 2A capital requirement, effective 1 January 2027, are expected to benefit Lloyds' capital position. Under Basel 3.1, changes to the regulatory treatment of corporate lending, particularly the reduction in the assumed loss given default (LGD) for eligible senior unsecured corporate loans from 45% to 40%, are expected to reduce the bank's risk-weighted assets (RWA) by approximately £6–8 billion. This would support Lloyds' CET1 capital ratio without requiring additional capital.
Meanwhile, the Pillar 2A CET1 requirement, which represents additional capital that banks must hold to cover risks not fully captured under standard regulatory calculations, will decline from approximately 1.4% to 1.2% of RWA.
Collectively, these changes are expected to increase Lloyds' capital headroom through lower risk-weighted assets and reduced regulatory capital requirements, providing greater flexibility to absorb unexpected losses and support future lending growth.
3) Robust liquidity and funding
The loan-to-deposit ratio rose slightly to 99% (FY2025: 97%), as lending growth of £14.4bn outpaced deposit growth of £6.3bn. Nevertheless, both the Liquidity Coverage Ratio (LCR) and Net Stable Funding Ratio (NSFR) remained comfortably above the regulatory minimum of 100%, at 143% and 123% respectively.
Table 2: Lloyds' key credit metrics
|
|
FY2023 |
FY2024 |
FY2025 |
9MFY2026 |
|
Non-performing loan ratio |
2.20% |
1.93% |
1.71% |
1.53% |
|
Stage 3 coverage ratio |
15.8% |
16.4% |
15.9% |
16.8% |
|
CET1 ratio |
14.6% |
14.2% |
14.0% |
13.3% |
|
Loan-to-deposit ratio |
95% |
95% |
97% |
99% |
|
Liquidity coverage ratio |
142% |
146% |
145% |
143% |
|
Net stable funding ratio |
130% |
129% |
124% |
123% |
Compared with its UK peers, Lloyds maintains a slightly lower CET1 ratio. This reflects a deliberate capital management strategy, as the Group continues to return excess capital to shareholders while moving towards its CET1 target of approximately 13.0%.
Table 3: CET1 ratios of major UK banks
|
Bank |
FY2025 |
Q3 2026 |
CET1 target |
|
HSBC |
14.9% |
13.9% |
14.0-14.5% |
|
Barclays |
14.3% |
14.2% |
13-14% |
|
NatWest |
14.0% |
13.5% |
c.13% |
|
Lloyds |
14.0% |
13.3% |
c.13.0% |
Source: Companies’ Reports, iFAST compilations. Data as of 30 Sep 2026.
Risks to consider
High concentration in the UK market: Unlike many of its peers, Lloyds Banking Group has limited geographical diversification, with its business largely concentrated in the UK. As a result, the Group’s performance remains closely linked to the performance of the UK economy, resulting in less diversified earnings compared with international peers such as HSBC.
Liquidity risk: Lloyds’ loan-to-deposit ratio is relatively high. While this reflects efficient utilisation of its deposit base, it also presents a potential vulnerability in the event of significant deposit withdrawals or a bank run, which could place pressure on the Group’s liquidity position.
However, this risk is mitigated by its Liquidity Coverage Ratio (LCR) of 143%, indicating that Lloyds holds sufficient high-quality liquid assets to cover projected net cash outflows over a 30-day period under severe financial stress.
Our view
Investors should remain mindful of certain risks. For instance, Lloyds’ strong concentration in the UK market makes the Group more sensitive to domestic economic conditions than its more geographically diversified peers. However, we believe the credit risk associated with its lending portfolio remains manageable at this juncture.
Overall, we continue to maintain our positive stance on Lloyds, supported by its resilient earnings profile and relatively healthy credit position.
For AUD-denominated bonds, investors may consider LLOYDS 5.802% 17Mar2029 Corp (AUD) and LLOYDS 7.086% 31Aug2033 Corp (AUD), offering yields to call (YTC) of 5.64% and 6.27%, respectively.
For USD-denominated bonds, investors may consider LLOYDS 3.574% 07Nov2028 Corp (USD), offering a YTC of 5.04%.
For GBP-denominated bonds, investors may consider LLOYDS 7.500% Perpetual Corp (GBP), offering a YTC of approximately 7.35%. However, investors should be mindful of the additional risks associated with perpetual bonds, including the possibility of coupon payments being deferred or cancelled, as well as the risk that the issuer may not exercise its call option.
Table 4: Existing bonds*
|
Bonds |
Years to next call / Years to maturity |
Yield to next call / Yield to maturity |
|
- / 1Y6M |
- / 5.63% |
|
|
1Y6M / 2Y6M |
5.64% / 6.15% |
|
|
3Y6M / 4Y6M |
5.76% / 5.84% |
|
|
4Y7M / 5Y7M |
5.94% / 5.97% |
|
|
1Y9M / 6Y9M |
6.27% / 7.33% |
|
|
1Y / 2Y |
5.04% / 5.14% |
|
|
8Y7M / 9Y7M |
6.35% / 6.35% |
|
|
2Y10M / - |
6.48% / - |
|
|
4Y10M / - |
6.57% / - |
|
|
3Y7M / - |
7.35% / - |
|
|
1Y8M / - |
6.32% / - |