- Azure drives faster growth: Revenue rose 18.8% YoY to USD92.3 billion in 1QFY2027 as Azure grew 48.0%, with Agents and Infra now contributing 83.2% of total revenue.
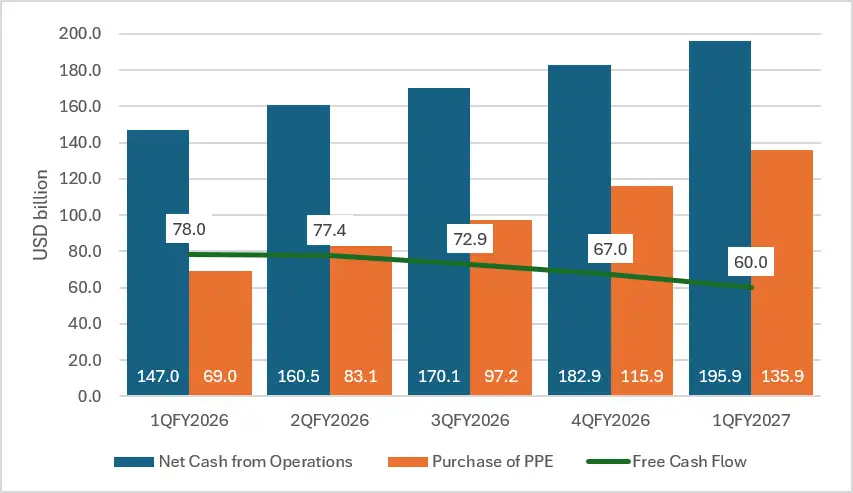
- AI spending continues to weigh on cash flow: Trailing-12-month capex rose 96.9% YoY to USD135.9 billion, pulling free cash flow down 23.1% to USD60.0 billion.
- Debt servicing capacity remains exceptionally strong: Lease-adjusted total debt-to-EBITDA improved to 0.65x from 0.72x a year earlier, while EBITDA covered interest expense 63.8x on a trailing-12-month basis.
- First US bond deal since 2017: Microsoft’s USD25 billion bond sale raises leverage only modestly, and its bonds yield 5.40% to 6.23%, broadly in line with Apple and tighter than Alphabet and Amazon.
Azure Leads Another Quarter of Accelerating Growth
Starting 1QFY2027, ended 30 September 2026, Microsoft now reports its business in two segments instead of three: Agents and Infra, which brings together Azure, Microsoft 365 (including Copilot), LinkedIn, Dynamics 365 and server licensing, and Devices and Consumer, which covers Windows OEM, Surface, Xbox and search advertising.
Previously, we highlighted Microsoft’s highly recurring, cloud-driven revenue base as a key support for its credit profile, and the latest quarter continued this trend. Total revenue rose 18.8% YoY to USD92.3 billion. Agents and Infra grew 24.5% YoY to USD76.8 billion (83.2% of total revenue), with growth driven by Azure, which grew 48.0% YoY to USD33.2 billion, ahead of management’s guidance of around 45.0%. Devices and Consumer, by contrast, fell 3.2% YoY to USD15.5 billion (16.8% of total revenue), as Windows OEM and devices revenue declined 22.0% YoY and Xbox content and services slipped 2.0%. This was partly offset by 12.0% growth in search and news advertising revenue, excluding traffic acquisition costs.
Margins Hold Up Despite Rising AI Costs
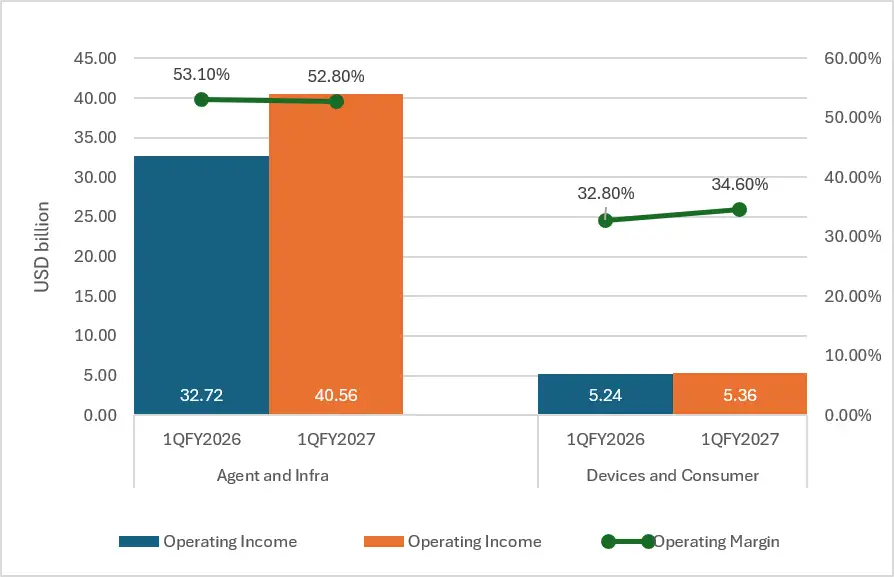
Operating income rose 21.0% YoY to USD45.9 billion, lifting operating margin to 49.8% from 48.9% a year earlier. As shown in Figure 1, Agents and Infra remained the key earnings contributor, with operating income up 24.0% YoY to USD40.6 billion (88.3% of total operating income). However, its operating margin edged down from 53.1% to 52.8%, as cost of revenue for the segment jumped 35.0% YoY, faster than its 24.5% revenue growth. This likely reflects the rising cost of running AI infrastructure, with depreciation rising 56.3% YoY to USD11.1 billion in 1Q2027, largely driven by Microsoft’s heavy investment in data centres and servers. Devices and Consumer operating income grew 2.2% YoY to USD5.4 billion despite lower revenue, lifting its margin to 34.6% from 32.8%, as segment cost of revenue fell 8.0% YoY.
Figure 1: Segment Operating Income and Operating Margin (1QFY2026 vs 1QFY2027)
Source: Company financials
Data as of 30 September 2026
Looking ahead, management guided 2QFY2027 revenue of USD96.0 billion to USD97.1 billion, with Azure growth expected to accelerate further to 49.0% to 50.0% in constant currency. As highlighted in our initiation, demand continues to exceed available capacity, and management added that some third-party data centre capacity expected in 1QFY2027 was delayed. On profitability, management expects operating margin to decline slightly YoY in 2QFY2027 as more capex feeds through as depreciation. Even so, at close to 50.0%, it leaves a very large earnings cushion for debt servicing.
Microsoft’s contracted backlog also provides good visibility over future earnings. Commercial remaining performance obligation (RPO) rose 73.0% YoY to USD677.0 billion, with around 30.0% expected to be recognised over the next 12 months. Much of this growth came from OpenAI’s Azure commitments signed back in October 2025, and RPO was broadly flat compared with the previous quarter With OpenAI still loss-making, Microsoft’s exposure to it is worth monitoring moving forward.
AI Spending Weighs on Free Cash Flow
As Microsoft continued ramping up its AI investments, trailing-12-month (TTM) purchases of property and equipment nearly doubled, rising 96.9% YoY to USD135.9 billion, from USD69.0 billion. Operating cash flow continued to grow, rising in every quarter over the past year to USD195.9 billion, up 33.2% YoY, but capex grew much faster. As shown in Figure 2, capex now absorbs around 69.4% of operating cash flow, up from 46.9% a year earlier. As a result, TTM free cash flow has declined for four consecutive quarters, falling 23.1% YoY to USD60.0 billion, from USD78.0 billion.
Unlike some of its hyperscaler peers, however, Microsoft’s free cash flow remains firmly positive, and the decline reflects deliberate investment rather than weaker cash generation. The spending is going into data centre capacity to meet demand for Azure and AI services, with roughly three-quarters of 1QFY2027 capex directed to short-lived assets such as CPUs and GPUs, up from about two-thirds in previous quarters. The spending is not slowing as management expects 2QFY2027 capex, including finance leases, to exceed USD50.0 billion, and USD170.0 billion in 2026.
Free cash flow remained sufficient to cover dividends, and share repurchases of approximately US$48.0 billion over the TTM period, although coverage narrowed to 1.2x from 1.4x in FY2026. Encouragingly, Microsoft reduced share repurchases under its buyback programme by 26.0% YoY to US$2.9 billion in 1QFY2027, providing some financial flexibility as buybacks are discretionary and could be scaled back further should cash flow tighten.
Figure 2: Trailing-12-Month Cash Flow (1QFY2026 – 1QFY2027)
 Source: Company financials
Data as of 30 September 2026
Leases Drive Debt Higher, but Leverage Remains Low
As of 30 September 2026, Microsoft’s total debt (including operating and finance lease liabilities) rose 11.3% YoY to USD133.9 billion, from USD120.4 billion (see Table 1). The increase was driven entirely by lease liabilities, as Microsoft leased more data centre capacity. As a result, finance lease liabilities rose 30.4% YoY to USD71.0 billion, and operating lease liabilities rose 20.9% YoY to USD27.5 billion. In contrast, Microsoft’s borrowings (current and long-term debt) fell 17.9% YoY to USD35.5 billion, as maturing debt was repaid. With total assets growing faster, up 22.5% YoY to USD779.4 billion, total debt-to-total assets eased to 17.2% from 18.9%.
Microsoft held USD64.5 billion in cash and short-term investments, the latter consisting largely of US government securities that can be converted into cash quickly. This was 36.8% lower than a year earlier, as both cash and cash equivalents (down 29.7% YoY) and short-term investments (down 39.6% YoY) were drawn down, likely to help fund capex. Combined with the rise in lease liabilities, net debt jumped to USD69.4 billion, from USD18.4 billion a year earlier. As total shareholders’ equity rose 29.6% YoY to USD470.5 billion, net debt-to-total equity remained low at 14.8%, up from 5.1%.
Looking ahead, lease liabilities are likely to keep rising. Leases signed but not yet commenced rose to around USD364.6 billion at end-1Q2027, from USD329.1 billion at end-FY2026. These are long-dated, debt-like commitments that will be added to Microsoft’s lease-adjusted debt as each site is completed.
Table 1: Microsoft’s Debt, Liquidity and Equity Position
|
1QFY2026 |
1QFY2027 |
YoY Change |
|
|
Total Debt [1] |
120,375 |
133,931 |
+11.26% |
|
Total Assets [2] |
636,351 |
779,403 |
+22.48% |
|
Total Debt / Total Assets [1/2] |
18.92 |
17.18 |
-1.73pp |
|
Cash and Short-Term Investments [3] |
102,012 |
64,509 |
-36.76% |
|
Net Debt [4, 1−3=4] |
18,363 |
69,422 |
+278.05% |
|
Total Equity [5] |
363,076 |
470,509 |
+29.59% |
|
Net Debt / Total Equity [4/5] |
5.06 |
14.75 |
+9.70pp |
|
Source: Company financials Data as of 30 September 2026 Debt figures are lease-adjusted (include operating and finance lease liabilities) |
|||
On a trailing-12-month (TTM) basis, EBITDA rose 23.6% YoY to USD205.7 billion, driven by a 20.1% increase in operating income and a 57.0% rise in depreciation as new data centres came online. As EBITDA grew faster than total debt, total debt-to-EBITDA improved to 0.65x from 0.72x a year earlier (see Table 2). Interest expense rose 28.9% YoY to USD3.2 billion, faster than EBITDA, so interest coverage eased slightly to 63.8x from 66.5x. Nonetheless, both ratios remain exceptionally strong. Microsoft could repay all of its lease-adjusted debt with less than eight months of EBITDA.
Table 2: Microsoft’s Total Debt-to-EBITDA and Interest Coverage Ratios
|
|
1QFY2026 |
1QFY2027 |
YoY Change |
|
Total Debt [1] |
120,375 |
133,931 |
+11.26% |
|
EBITDA [2] |
166,437 |
205,691 |
+23.58% |
|
Total Debt / EBITDA [1/2] |
0.72 |
0.65 |
-0.07x |
|
Interest Expense [3] |
2,501 |
3,223 |
+28.87% |
|
Interest Coverage Ratio [2/3] |
66.5 |
63.8 |
-2.73x |
|
Source: Company financials Data as of 30 September 2026, on a trailing twelve-month basis Debt figures are lease-adjusted (include operating and finance lease liabilities) |
|||
US$25 Billion Bond Sale: What It Means for Bondholders
Following its latest earnings release, Microsoft returned to the US bond market for the first time since 2017, pricing a USD25 billion bond sale across ten tranches maturing from 2028 to 2066, with coupons ranging from 4.85% to 6.35%. The deal reportedly drew orders of more than USD100 billion, around four times the amount raised, and proceeds will be used for general corporate purposes, including capex.
The impact on Microsoft’s credit profile is limited. Adding the full USD25 billion would lift lease-adjusted total debt to around USD158.9 billion, pushing total debt-to-EBITDA up to 0.77x. The new bonds would add roughly USD1.2 billion to USD1.6 billion of annual interest expense, bringing interest coverage down to around 43x to 46x, which remains exceptionally strong.
For bondholders, the deal signals that Microsoft is increasingly willing to use debt alongside its own cash to fund its AI build-out, and further issuance in the coming quarters would not be surprising. While this does not threaten its credit quality, a larger supply of Microsoft bonds could weigh on the prices of its existing bonds in the near term.
Overall, Microsoft’s credit profile remains exceptionally strong, and its AAA / Aaa / – (S&P / Moody’s / Fitch) ratings were unchanged. Revenue growth is accelerating, operating margin is close to 50%, free cash flow remains positive, and lease-adjusted leverage remains well below 1x EBITDA. While the USD 25 billion bond issuance and rising lease commitments mean leverage is likely to rise from very low levels, we expect Microsoft’s credit profile to remain stable.
Bond Comparison – Modest Value in Microsoft Bonds
Against the US Treasury curve, the MSFT 4.200% 03Nov2035 Corp (USD) offers a yield-to-worst (YTW) of 5.40%, a pickup of 31 bps (see Table 3).
Compared against Apple (AA+ / Aaa / –), which sits one notch below Microsoft at S&P and shares its Aaa rating at Moody’s, the MSFT 4.200% 03Nov2035 Corp (USD) yields 7 bps more than the AAPL 4.750% 12May2035 Corp (USD) at 5.33% and offers a slightly higher pickup over Treasuries (31 bps versus 25 bps), despite Microsoft’s stronger credit rating. Against Alphabet (AA+ / Aa2 / –) and Amazon (AA / A1 / AA-), which sit one to two notches below Microsoft at S&P and two to four notches below at Moody’s, Microsoft trades tighter. The GOOGL 4.700% 15Nov2035 Corp (USD) and AMZN 4.650% 20Nov2035 Corp (USD) yield 5.85% and 5.91% respectively, a pickup of 45 bps and 51 bps over the Microsoft bond, consistent with their lower credit ratings.
Table 3: Bond Comparison (Less than 10 Years to Maturity)
|
Issuer |
Issue |
Ask Price |
Yield to Worst (%) |
Call / Maturity Date |
Credit Ratings |
Issuer |
|
Microsoft Corp |
91.57 |
5.40 |
03May2035 / 03Nov2035 (8.5 / 9.0) |
AAA / Aaa / - |
Microsoft Corp |
|
|
Amazon.com Inc |
AMZN 4.650% 20Nov2035 Corp (USD) |
91.31 |
5.91 |
20Aug2035 / 20Nov2035 (8.8 / 9.0) |
AA / A1 / AA- |
Amazon.com Inc |
|
Apple Inc |
AAPL 4.750% 12May2035 Corp (USD) |
96.10 |
5.33 |
12Feb2035 / 12May2035 (8.3 / 8.5) |
AA+ / Aaa / - |
Apple Inc |
|
Alphabet Inc |
GOOGL 4.700% 15Nov2035 Corp (USD) |
92.02 |
5.85 |
15Aug2035 / 15Nov2035 (8.8 / 9.0) |
AA+ / Aa2 / - |
Alphabet Inc |
|
Source: Bloomberg and Bondsupermart Data as of 13 November 2026 |
||||||
Further out the curve, Microsoft’s bonds trade broadly in line with or tighter than Apple, and well inside Alphabet and Amazon (see Table 4). Between 2041 and 2043, Microsoft yields less than Apple, with the MSFT 5.300% 08Feb2041 Corp (USD) at 5.73% and the MSFT 4.875% 15Dec2043 Corp (USD) at 5.90%, 13 bps below Apple’s 2041 and 2043 issues, leaving no value in this part of the curve.
Beyond 2050, however, the MSFT 2.525% 01Jun2050 Corp (USD) and MSFT 2.921% 17Mar2052 Corp (USD) yield 6.18% and 6.16%, a small pickup of 4 bps over Apple’s 2050 and 2052 issues, and only 9 bps less than the GOOGL 2.050% 15Aug2050 Corp (USD) at 6.27%. Amazon’s long-dated bonds yield 6.16% to 6.70%, a pickup of 34 to 47 bps over comparable Microsoft bonds, consistent with its lower ratings.
Table 4: Bond Comparison (More than 10 Years to Maturity)
|
Issuer |
Issue |
Ask Price |
Yield to Worst (%) |
Call / Maturity Date |
Credit Ratings |
|
Microsoft Corp |
95.84 |
5.73 |
- / 08Feb2041 (- / 14.2) |
AAA / Aaa / - |
|
|
Microsoft Corp |
89.08 |
5.90 |
15Jun2043 / 15Dec2043 (16.6 / 17.1) |
AAA / Aaa / - |
|
|
Microsoft Corp |
54.96 |
6.18 |
01Dec2049 / 01Jun2050 (23.1 / 23.6) |
AAA / Aaa / - |
|
|
Microsoft Corp |
58.71 |
6.16 |
17Sep2051 / 17Mar2052 (24.9 / 25.3) |
AAA / Aaa / - |
|
|
Microsoft Corp |
70.54 |
6.23 |
12Aug2054 / 12Feb2055 (27.8 / 28.3) |
AAA / Aaa / - |
|
|
Amazon.com Inc |
AMZN 2.875% 12May2041 Corp (USD) |
68.79 |
6.16 |
12Nov2040 / 12May2041 (14.0 / 14.5) |
AA / A1 / AA- |
|
Amazon.com Inc |
AMZN 2.500% 03Jun2050 Corp (USD) |
51.91 |
6.52 |
03Dec2049 / 03Jun2050 (23.1 / 23.6) |
AA / A1 / AA- |
|
Amazon.com Inc |
AMZN 3.950% 13Apr2052 Corp (USD) |
67.48 |
6.61 |
13Oct2051 / 13Apr2052 (24.9 / 25.4) |
AA / A1 / AA- |
|
Amazon.com Inc |
84.08 |
6.70 |
20May2055 / 20Nov2055 (28.5 / 29.0) |
AA / A1 / AA- |
|
|
Apple Inc |
AAPL 2.375% 08Feb2041 Corp (USD) |
66.70 |
5.86 |
08Aug2040 / 08Feb2041 (13.7 / 14.2) |
AA+ / Aaa / - |
|
Apple Inc |
AAPL 3.850% 04May2043 Corp (USD) |
77.45 |
6.03 |
- / 04May2043 (- / 16.5) |
AA+ / Aaa / - |
|
Apple Inc |
56.87 |
6.14 |
11Nov2049 / 11May2050 (23.0 / 23.5) |
AA+ / Aaa / - |
|
|
Apple Inc |
72.01 |
6.12 |
08Feb2052 / 08Aug2052 (25.2 / 25.7) |
AA+ / Aaa / - |
|
|
Alphabet Inc |
48.22 |
6.27 |
15Feb2050 / 15Aug2050 (23.3 / 23.8) |
AA+ / Aa2 / - |
|
|
Alphabet Inc |
GOOGL 5.250% 15May2055 Corp (USD) |
83.00 |
6.58 |
15Nov2054 / 15May2055 (28.0 / 28.5) |
AA+ / Aa2 / - |
|
Source: Bloomberg and Bondsupermart Data as of 13 November 2026 |
|||||
Overall, we view Microsoft’s bonds as fairly priced.
We recommend the MSFT 4.200% 03Nov2035 Corp (USD), which offers a YTW of 5.40% at an ask price of 91.57, with approximately 9.0 years to maturity. It provides a modest pickup over the comparable Apple bond, and with a shorter tenor, its price is less sensitive to changes in interest rates than Microsoft’s longer-dated bonds.
For investors comfortable with a longer tenor, the MSFT 2.525% 01Jun2050 Corp (USD) offers a higher YTW of 6.18%, with approximately 23.5 years to maturity. The issue is available on Bondsupermart Live and can be traded with a minimum order size of USD2,000 and increments of USD1,000. However, investors should note that at this tenor, the price can fluctuate significantly, and the bond is best suited for investors looking to trade instead of holding to maturity.
Declaration: For specific disclosure, at the time of publication of this report, IFPL (via its connected and associated entities) holds positions in MSFT 2.525% 01Jun2050 Corp (USD), GOOGL 2.050% 15Aug2050 Corp (USD), and AMZN 5.450% 20Nov2055 Corp (USD). The analyst who produced this report holds NIL positions in the abovementioned securities. This research report was prepared with the assistance of artificial intelligence (AI) tools. iFAST Financial Pte Ltd does not rely exclusively on AI for content generation; the content of this report – including all investment theses, ratings, price targets and conclusions – has been independently reviewed and verified by the research analyst(s) to ensure accuracy and professional integrity.