Highlights:
- Benefiting from the popularization of smart devices, Hynix’s revenue increased in 2021. After the acquisition of Intel’s NAND business, Hynix became the second-largest memory chip producer, tagging along after Samsung electronics.
- Hynix reported a small-sized debt that is mainly long-term debt. Its abundant cash balance will help maintain decent liquidity. Based on its good track records, the overall credit profile demonstrated a remarkable improvement in 2021.
- Bond due 2026 is currently yielding 4.7% with a credit rating of BBB- (S&P). Investors seeking stable income can consider it.
As investors may know, Korea is well developed in the semiconductor industry. In this article, we will take a look at SK Hynix ("Hynix”), the leading memory semiconductor producer based in Korea.
Company Background
Founded in 1983, Hynix was formerly Hyundai Electronics Industry Co., Ltd. It was only named SK Hynix after a partial acquisition in 2012 by SK Group, a major Korean conglomerate. As of December 2021, SK Group had approximately 20% of ownership on Hynix.
Hynix has been listed on the Korea exchange since 1996 (stock code: 660. KS). Its current market capitalization is close to KWR 66.0 trillion.
Hynix’s major business comprises the production of memory chips which are mainly divided into memory (SDRAM) and storage chips (NAND Flashing Memory). Hynix is the fourth largest semiconductor company in the world in terms of total sales volume in 2021, trailing behind Samsung Electronics, Intel, and TSMC.
Snowballing Seen in the Memory Sector, Expecting to Break the Circle of Periodic Fluctuation
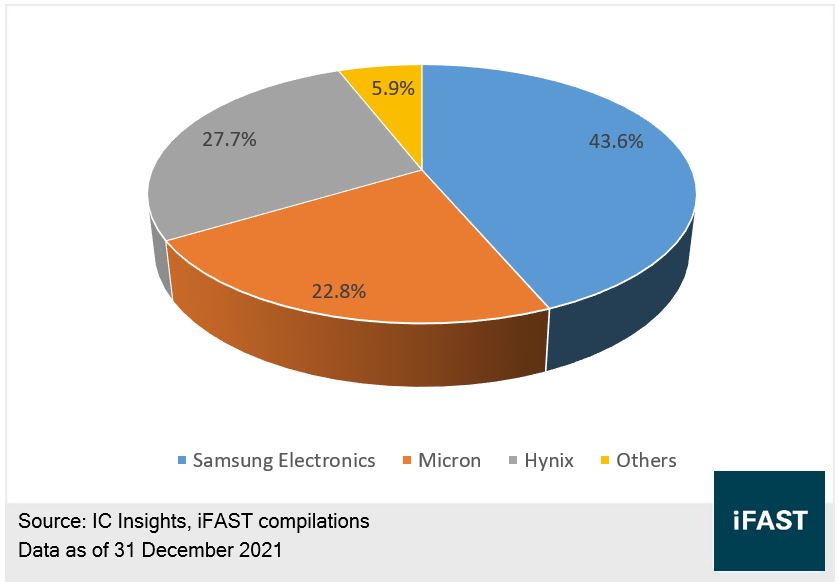
Hynix is the undisputed leader in the memory semiconductor industry, particularly in manufacturing SDRAM. According to IC Insights (see Chart 1), as of December 2021, the global SDRAM industry is highly monopolistic. Samsung Electronics, Hynix, and Micron together dominated over 90% of memory production. Hynix’s market share stood at 28%, trailing behind Samsung Electronics.
Chart 1: Hynix's Market Share of SDRAM
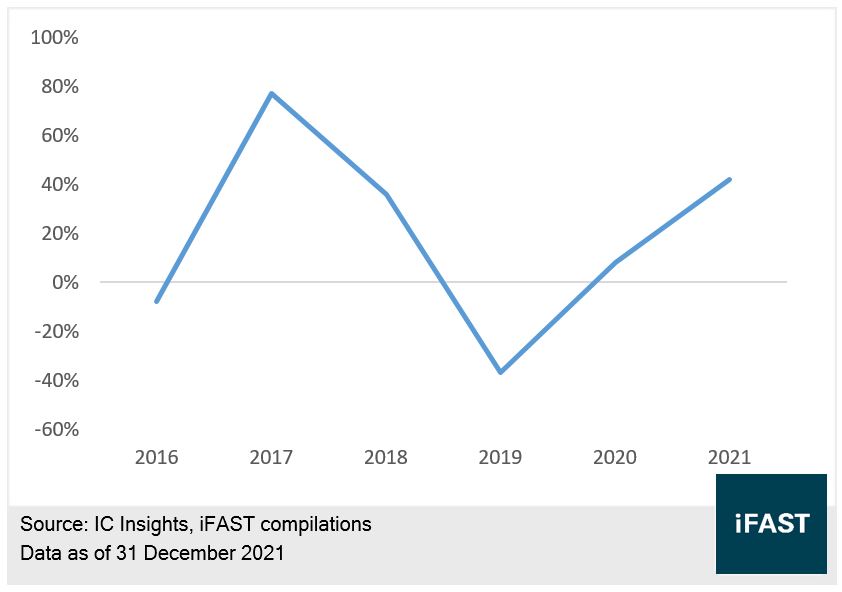
It is noteworthy that SDRAM is a typical cyclical industry. Data from IC Insights illustrated that the average price of SDRAM is quite volatile (see Chart 2). For example, the average price first soared roughly 80% in 2017, then plunged nearly 40% in 2019. Obviously, the market’s volatility was caused by the increased the price driven by high demands, chip producers then expand its production capacity. Yet, as the market became oversupplied, the price would turn into a downward trend. Each cycle lasts roughly three years, which coincides with the time spent by manufacturers from construction to production.
Chart 2: Price Change of SDRAM
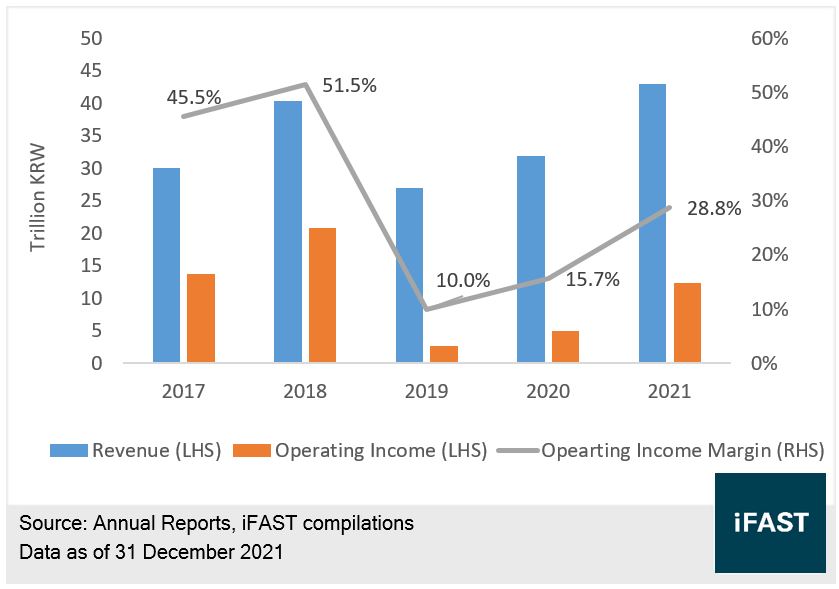
Hynix’s revenue has experienced significant ups and downs because of industry volatility (see Chart 3), its revenue in 2019 and 2020 has recorded a decline compared to that of 2018. However, owing to the rapid development of 5G devices, AI, as well as the internet of things, the demand for memory has witnessed exponential growth—Hynix’s revenue in 2021 rose by approximately 35% to KRW 43.0 trillion and its operating income reached KRW 12.4 trillion with the operating income margin of 28.8%.
Chart 3: Revenue and Profit
In the long term, research from IC Insights shows that the global memory market is expected to reach USD 221.7 billion by 2030 with a CAGR of 9% from now. It suggests that the industry still have ample room to grow. Moreover, monopolized by the three giants, their capacity expansions are getting increasingly rational. That said, product prices will probably break the cyclical fluctuations. As a result, Hynix’s revenue in the memory segment is expected to maintain stable growth.
The Acquisition of Intel’s NAND Business Might Be New Growth Driver
In terms of the segment of storage chips, Hynix used to be the world’s third-largest chip maker behind Samsung Electronics and Kioxia (Once part of Toshiba Semiconductor) for a long time , taking up about 15% of the market share. In 2020, Hynix announced the acquisition of Intel’s NAND business at the cost of USD 9 billion. After being approved by relevant authorities, Hynix officially completed the first phase of acquisition in December 2021, obtaining Intel’s production facility in Dalian, China. The second phase of acquisition is expected to be settled after March 2025, at which time some of the remaining assets will be incorporated.
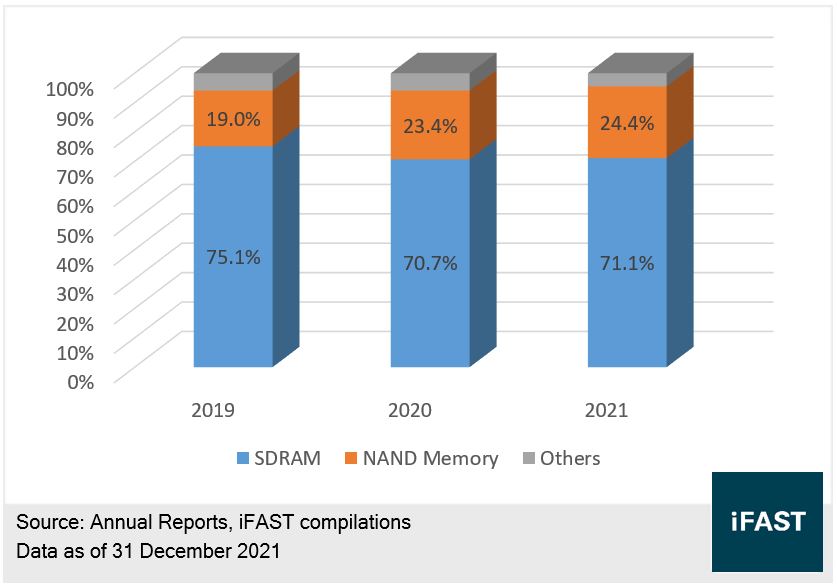
As of December 2021, the storage chips segment accounted for 24.4% of total revenue (Chart 4). Hynix’s market share has surpassed Kioxia, making it the second-largest storage chip maker after the acquisition. It is expected that the percentage of revenue of the storage chips segment will skyrocket.
Similar to the memory market, the storage chip market is blooming. The demand for storage in both cloud computing and consumer electrics like smartphones, will continue to expand along with the growing data volume. The sales of storage chips is expected to reach USD 25.7 billion by 2026, representing a 7% CAGR from now. In summary, we believe that Hynix’s two major segments have robust potential and will sustain rapid growth.
Chart 4: Revenue Breakdown
Abundant Cash with Desirable Debt Structure
As mentioned above, Hynix acquired Intel’s NAND business with USD 9 billion. Will this tremendous cash outflow tighten its liquidity? Since the first stage of acquisition was completed last December, the USD 8.9 billion payment has already been reflected on the balance sheet.
As of December 2021, Hynix owned KRW 5.1 trillion worth of cash and cash equivalents. Its short-term and long-term debt is KRW 2.9 trillion and KRW 14.7 trillion, respectively. That means the company’s cash to short-term debt ratio was 1.8x, hinting at its favorable liquidity. For the second phase of acquisition, it will only have finite influence on liquidity given by the small amount of payment (USD 2 billion).
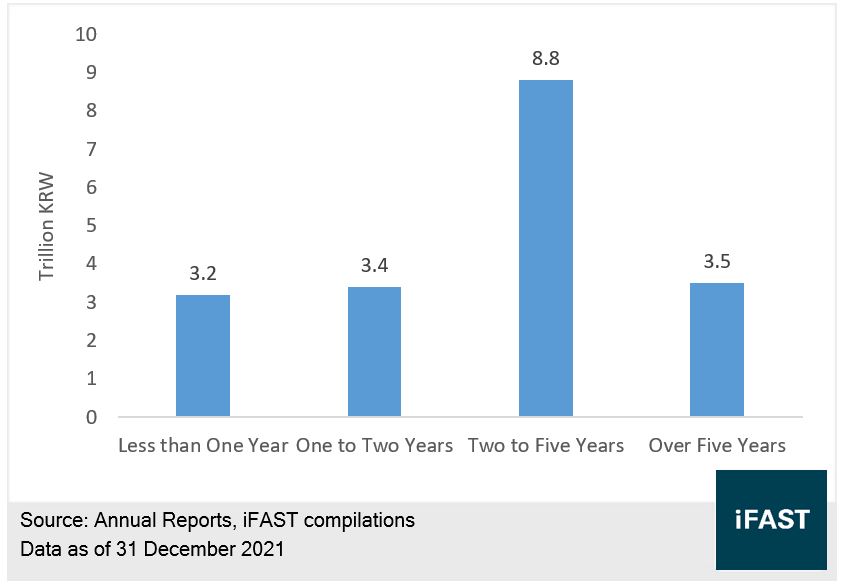
It is worth mentioning that the company reported a desirable debt structure which was principally made up of long-term debt (Chart 5). A total of KRW 8.8 trillion debt will be matured in two to five years, giving the company ample time to raise funds. It is expected that the liquidity will remain at a decent level.
Chart 5: Debt Structure
Improved Credit Metrics, Overall Credit Profile Outstands
In terms of other credit metrics, Hynix’s cash flow from operating significantly increased due to strong performance over the past two years and result in various degrees of improvement in the credit metrics (Table 1).
Table 1: Credit Metrics
|
2021 |
2020 |
|
|
Net Gearing Ratio |
12.1% |
14.4% |
|
Cash to Short-term Debt |
1.8x |
1.0x |
|
Total Debt/EBITDA |
1.5x |
2.6x |
|
Source: Annual Report Data as of 31 December 2021 |
||
As of December 2021, the company’s net gearing ratio declined to 12.1% and the total debt/EBITDA ratio also saw a downward movement, from 2.6x in 2020 to 1.5x in 2021. The ratio is expected to fall below 1x by the end of this year as a consequence of its continuous excellent operating performance. As an asset-based manufacturing company, Hynix’s financial leverage is quite low and its overall solvency is outstanding.
2026 USD Bond Is Worth Investing In
The two USD bonds issued by Hynix are tradable on our platform. Their credit rating is BBB- by S&P. Other specifications are shown below:
Table 2: USD Bonds
|
Bonds |
Years to Maturity |
Ask Price |
YTM |
|
HYUELE 1.000% 19Jan2024 Corp (USD) |
1.5 |
95.2 |
4.3% |
|
HYUELE 1.500% 19Jan2026 Corp (USD) |
3.5 |
89.6 |
4.7% |
|
Sources: Bondsupermart Data as of 15 July 2022 |
|||
As shown in table 2, the investment horizon of the two bonds ranges from approximately two to four years. The yield to maturity of bonds due 2026 rose to 4.7% , subsequent to interest rate hikes. We think the YTMs have exhibited great investment attractiveness. Thus, investors interested in Hynix can put consideration into it.
Corporate Risk
Investors should be aware of the following risks. First, Hynix’s business may face increasing competition from Chinese peers. For example, Yangtze Memory, only founded in 2016, has a global NAND flash memory market share of about 2% in 2021 and is expected to double this year. Although the storage semiconductor industry is currently oligopolistic, the technological barriers are not as high as other semiconductor segments. Consequently, Chinese peers may possibly squeeze Hynix’s growth potential.
Additionally, Hynix might be exposed to foreign exchange risk. KRW has depreciated over 7% against USD year to date, and the exchange rate hit a 13-year low in mid-April. On account of the high dependence on imports of semiconductor raw materials, the depreciation of KRW will push up production costs, which in turn weakens profit margins.
Conclusion
Benefiting from the popularization of smart devices, Hynix’s revenue increased in 2021. After the acquisition of Intel’s NAND business, Hynix became the second-largest memory chip producer, tagging along after Samsung electronics.
Hynix reported a small-sized debt that is mainly long-term debt. Its abundant cash balance will help maintain decent liquidity. Based on its good track records, the overall credit profile demonstrated a remarkable improvement in 2021.
Bond due 2026 is currently yielding 4.7% with a credit rating of BBB- (S&P). Investors seeking stable income can consider it.
For specific disclosure, at the time of publication of this report, IFPL (via its connected and associated entities) and the analyst who produced this report hold a NIL position in the abovementioned securities.