- Downgrading EM debt to negative. Oil, a hiking Fed, a stronger dollar and decade-tight spreads have all moved against us, and they hit local- and hard-currency EM debt through different channels, leaving neither a safe place to hide.
- Energy shock now, with potential of food inflation next. Brent is above US$100, freight is up about 55% ytd, and food prices are at a near four-year high with El Niño ahead.
- Local currency: the easing cycle has stalled. Weaker currencies and imported inflation mean markets now price hikes in most EMs over the next 12 months, with Brazil and China the exceptions.
- Hard currency: little buffer. Rising Treasury yields, subsidy-strained budgets (broad price support costs 3–6x more than targeted cash) and spreads tighter than in 90% of weeks over the past decade leave little upside and plenty of downside.
Why we are downgrading
Earlier this year, we turned neutral to slightly negative on EM debt. Higher oil prices weigh disproportionately on economies that rely on imported oil, EM spreads had fallen to low levels relative to history, and several EM central banks were coming under pressure to hike.
Since then, each of those concerns has firmed. Oil has stayed elevated, the Fed has resumed hiking, central banks from Indonesia to India have tightened, and spreads touched 10-year lows before beginning to widen. With a potentially strong El Niño adding a further risk to food prices into 2027, we are moving our outlook to negative.
These pressures do not land evenly across the asset class, but they do not stay contained either. Inflation, weaker currencies and a stalled easing cycle hit local-currency debt most directly, since investors carry both interest-rate and currency risk. Rising US Treasury yields, subsidy-driven fiscal strain and tight spreads hit hard-currency debt most directly, as it is priced as a spread over Treasuries.
The channels also cross over. Weaker currencies raise the local cost of servicing dollar debt, which worsens sovereign credit metrics and pressures hard-currency spreads. Higher Treasury yields drive capital outflows that weigh EM currencies and keep local central banks from easing. With the risks reinforce each other across segments, switching between them offers little protection. That’s why our negative view applies to EM debt as a whole.
Table 1: How the current risks reach EM debt
|
Risk |
Local-currency EM debt |
Hard-currency EM debt |
|
Higher oil and food prices |
Inflation pushes local yields up and delays rate cuts |
Indirect: subsidies widen deficits and weigh on credit quality |
|
Relative stronger US dollar |
Currency losses for unhedged investors |
Indirect: raises the local cost of servicing dollar debt, pressuring spreads |
|
Fed hikes and higher Treasury yields |
Indirect: capital outflows and a narrower gap with US rates limit room to cut |
Higher Treasury yields flow straight into bond yields |
|
Valuations |
Real yields eroded as inflation rises |
Spreads near decade lows leave little cushion |
|
Source: iFAST compilations. Data as of 15 October 2026. |
||
1. The common shock: energy now, potential of food risk ahead
Oil has not come down. Brent settled above US$100 per barrel, and the level remains far above where EM central banks started the year, when Brent was trading in the low-to-mid US$60s.
A bigger import bill hurts EM importers through three channels. It widens the current account deficit and weighs on the currency. A weaker currency then raises the local cost of fuel and lifts inflation, limiting central banks’ room to ease. Governments also come under pressure to cushion households with subsidies, which strains public finances. The first two channels fall mainly on local-currency debt, the third mainly on hard-currency debt.
Commodity exporters such as Malaysia, Colombia and Brazil are partly shielded, as higher prices also lift their export earnings.
Chart
1: Approximate net oil and gas imports, % of GDP (2025)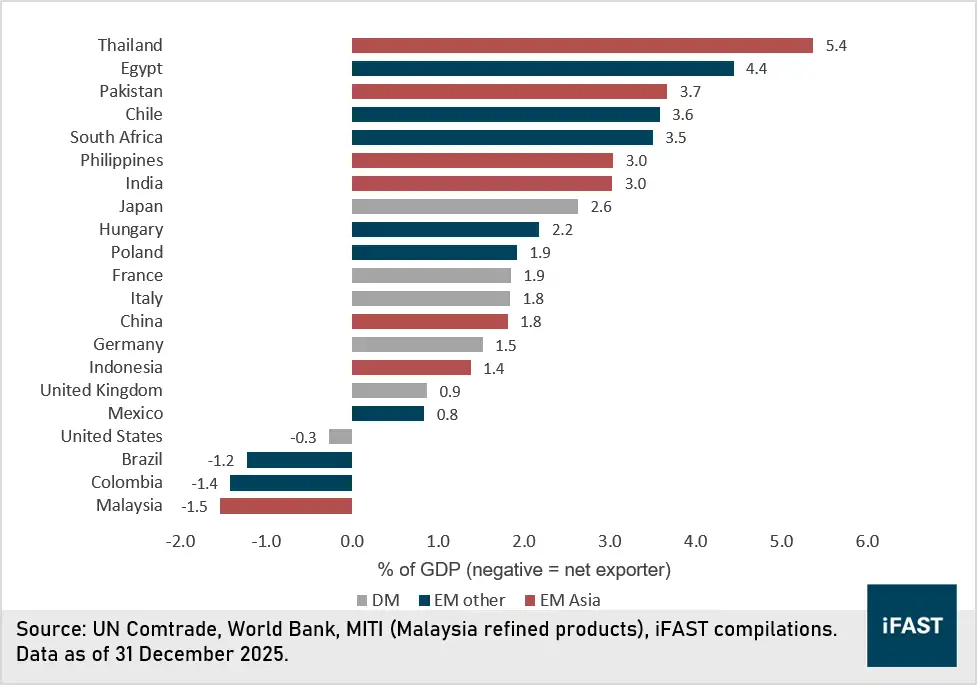
Shipping costs add to the bill. The Baltic Dry Index, which tracks the cost of shipping bulk commodities such as grain, coal and iron ore, closed at 2,917 on 9 October 2026. That is about 55% higher than at the start of the year.
Higher shipping costs weigh most on economies that import more of what they consume, especially lower-income countries. As freight is also priced in US dollars, EMs with weakening currencies pay more again in local terms.
Chart 2:
Baltic Dry Index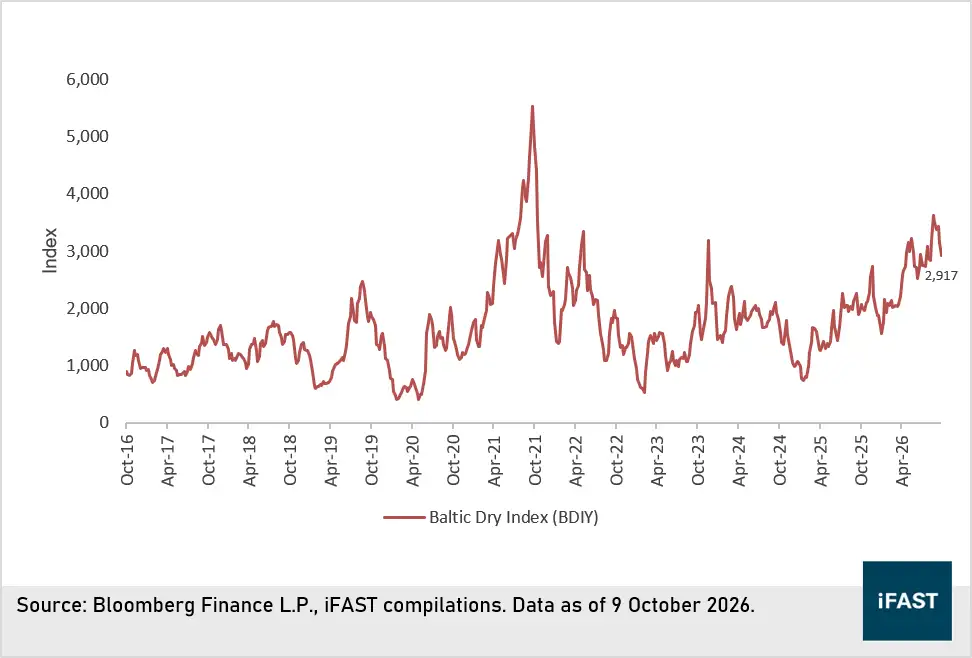
The IMF's numbers reflect these developments. It raised its 2026 EM inflation forecast from 4.8% to 5.5% in April, and again to 5.8% in July, against 3.0% for advanced economies.
Food inflation is the risk ahead. The FAO Food Price Index rose for a third straight month in September, to 136.0 points, its highest since November 2022 and 5.8% higher than a year earlier. Sugar rose 6.1% on the month, partly on lower expected output in Thailand and below-normal rain in India, and cereals rose 5.1%. Vegetable oils, driven largely by palm oil, are at their highest since early 2022, while meat and dairy prices are flat or falling.
As food typically accounts for a far larger share of the CPI basket in developing economies than in developed markets, any further rise in food prices would hit headline inflation and inflation expectations much harder in EM.
Chart 3: FAO
Food Price Index and sub-indices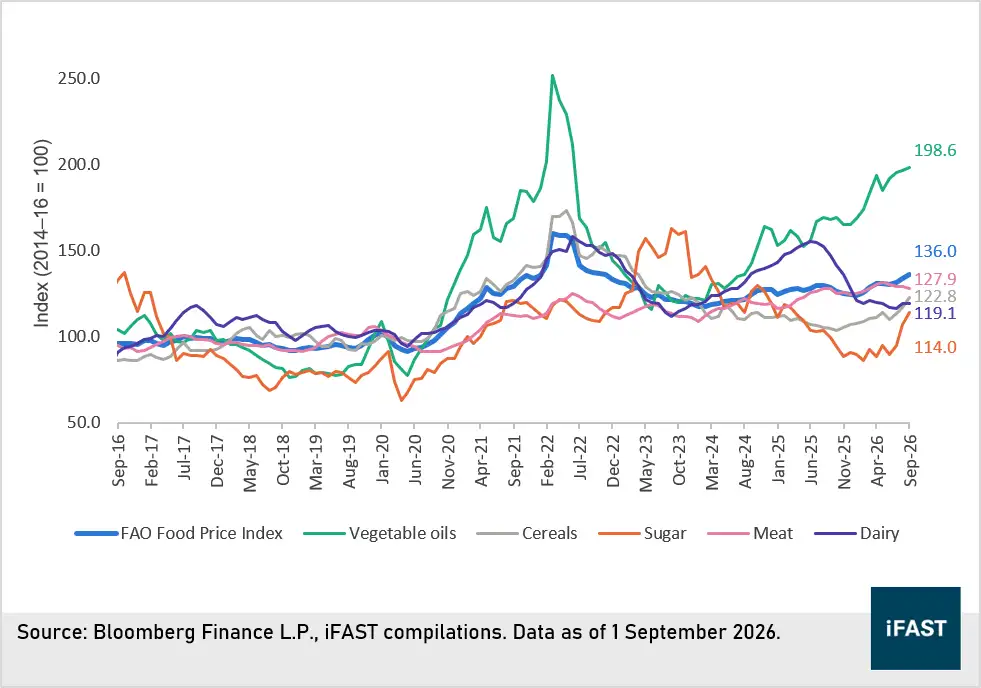
2. Local-currency debt: the easing cycle has stalled
Local-currency bonds carry two exposures, local interest rates and the currency. Both are now moving against investors.
At the start of 2026, the consensus expected EM central banks to keep easing alongside a cutting Fed. That narrative has been overturned where the main constraints today are:
- Currency defence. A resilient dollar has forced some central banks to tighten or hold to stabilise their currencies, regardless of the domestic growth picture.
- Imported energy inflation. Higher oil prices feed directly into fuel and transport costs, lifting headline inflation across energy importers.
- A narrowing gap with the Fed. With US rates rising, central banks have less room to cut rates.
Bloomberg's market-implied policy rates show further hikes priced over the next 12 months in most of the EMs, with about 117bps in India, 116bps in Poland and the Czech Republic, 78bps in the Philippines and 68bps in Mexico. Only Brazil, where cuts of about 190bps are still priced, and China stand apart.
Chart
4: Market-implied change in policy rates over the next 12 months, selected EMs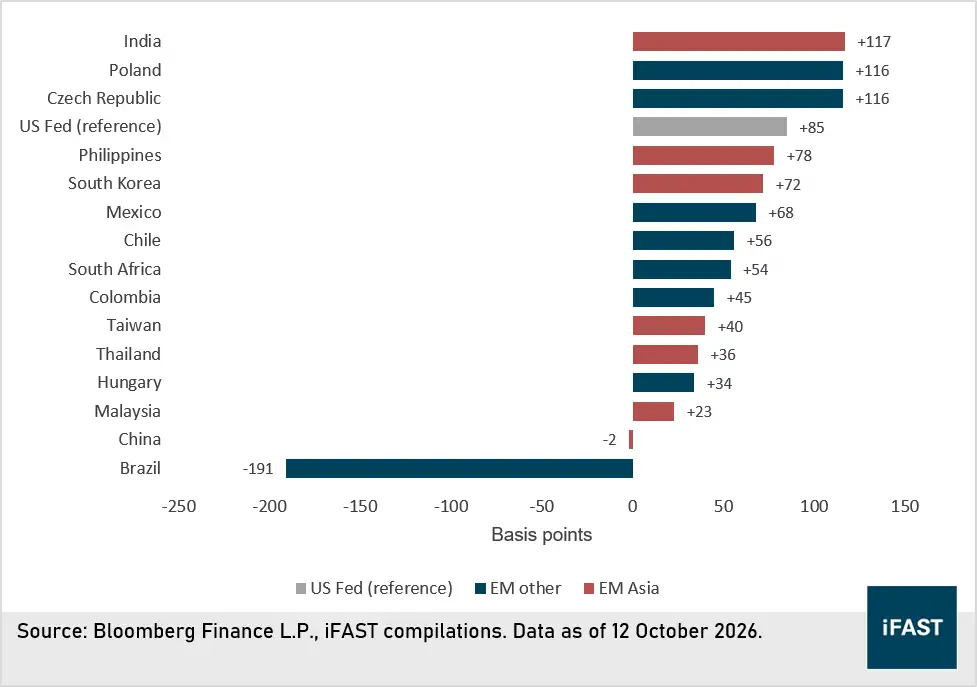
For local-currency EM debt investors, this is a double whammy. Bond prices fall as markets price hikes instead of cuts, and returns are reduced further when the currency weakens against the US dollar. Food inflation is the next risk for this segment: with food carrying a heavier weight in EM CPI baskets, an El Niño-driven rise in food prices would make central banks even slower to ease.
3. Hard-currency debt: higher Treasury yields, strained budgets and little buffer
Hard-currency bonds avoid direct currency risk, but they are priced as a spread over US Treasuries. That leaves them exposed to both a rising risk-free rate and any widening in spreads, and both risks are building.
Higher Treasury yields feed straight through. With the Fed resuming hikes in September, higher US Treasury yields flow directly into hard-currency EM bond yields.
Relief is costly for budgets. When fuel and food prices rise, governments usually step in to protect households. In emerging markets, they tend to do this by keeping prices low for everyone, through fuel and food subsidies, price caps or tax cuts, rather than giving direct help only to those who need it most.
The IMF estimates that helping a low-income household this way can cost three to six times as much as simply giving it cash, and up to 22 times as much when the money is paid to fuel or power companies to hold prices down. For governments already carrying high debt, this means bigger deficits and more borrowing just as borrowing costs are rising, a credit risk in itself.
To be fair, tighter spreads are not irrational. EM credit is in better shape than in past cycles.
1) Fitch counted seven EM sovereign upgrades in 2026 against two downgrades as of mid-July.
2) EM sovereigns recorded zero defaults in both 2024 and 2025.
3) More EM countries now operate inflation-targeting regimes and fiscal rules than 15 years ago.
However, EM is not one credit. Much of this year's improvement comes from lower-rated issuers recovering from distress. Of Fitch's seven sovereign upgrades this year, six were to sub-investment-grade issuers (Argentina, Bolivia, Ecuador, Ghana, the Maldives and South Africa) with several of them emerging from default. The seventh, Aruba, is a very small issuer. The six high-yield names have improved from a low base and remain the most exposed to the shocks now building.
Apart from that, sovereign CDS for most EMs sits close to its one-year average, despite the oil shock and the Fed's turn, leaving little room for any unexpected adverse changes.
Table 2: EM sovereign CDS level
|
Country |
Region |
5Y CDS now (bps) |
1-year average (bps) |
Difference (bps) |
|
Malaysia |
Asia |
36 |
39 |
-3 |
|
China |
Asia |
37 |
42 |
-5 |
|
Thailand |
Asia |
40 |
45 |
-5 |
|
Philippines |
Asia |
79 |
68 |
+11 |
|
Indonesia |
Asia |
92 |
85 |
+7 |
|
Pakistan |
Asia |
382 |
416 |
-34 |
|
Abu Dhabi |
EMEA |
38 |
36 |
+2 |
|
Qatar |
EMEA |
44 |
35 |
+9 |
|
Saudi Arabia |
EMEA |
66 |
68 |
-2 |
|
Dubai |
EMEA |
68 |
67 |
+1 |
|
Kazakhstan |
EMEA |
85 |
77 |
+8 |
|
Oman |
EMEA |
85 |
78 |
+7 |
|
Morocco |
EMEA |
99 |
81 |
+18 |
|
South Africa |
EMEA |
137 |
143 |
-6 |
|
Türkiye |
EMEA |
246 |
238 |
+8 |
|
Nigeria |
EMEA |
265 |
296 |
-31 |
|
Egypt |
EMEA |
316 |
312 |
+4 |
|
Bahrain |
EMEA |
362 |
243 |
+119 |
|
Angola |
EMEA |
391 |
450 |
-59 |
|
Kenya |
EMEA |
416 |
406 |
+10 |
|
Chile |
Americas |
56 |
49 |
+7 |
|
Uruguay |
Americas |
63 |
58 |
+5 |
|
Peru |
Americas |
67 |
69 |
-2 |
|
Mexico |
Americas |
94 |
92 |
+2 |
|
Panama |
Americas |
96 |
112 |
-16 |
|
Brazil |
Americas |
111 |
132 |
-21 |
|
Guatemala |
Americas |
115 |
117 |
-2 |
|
Costa Rica |
Americas |
129 |
126 |
+3 |
|
Colombia |
Americas |
159 |
189 |
-30 |
|
El Salvador |
Americas |
259 |
279 |
-20 |
|
Ecuador |
Americas |
492 |
421 |
+71 |
|
Argentina |
Americas |
701 |
496 |
+205 |
|
Source: Bloomberg Finance L.P., iFAST compilations. Data as of 12 October 2026. |
||||
The same story is seen in the spreads, which hit the tightest levels of the past 10 years between June and September 2026. Even after the recent move wider, spreads were tighter than in more than 90% of weeks over the past decade.
Chart 5: EM
sovereign and corporate spreads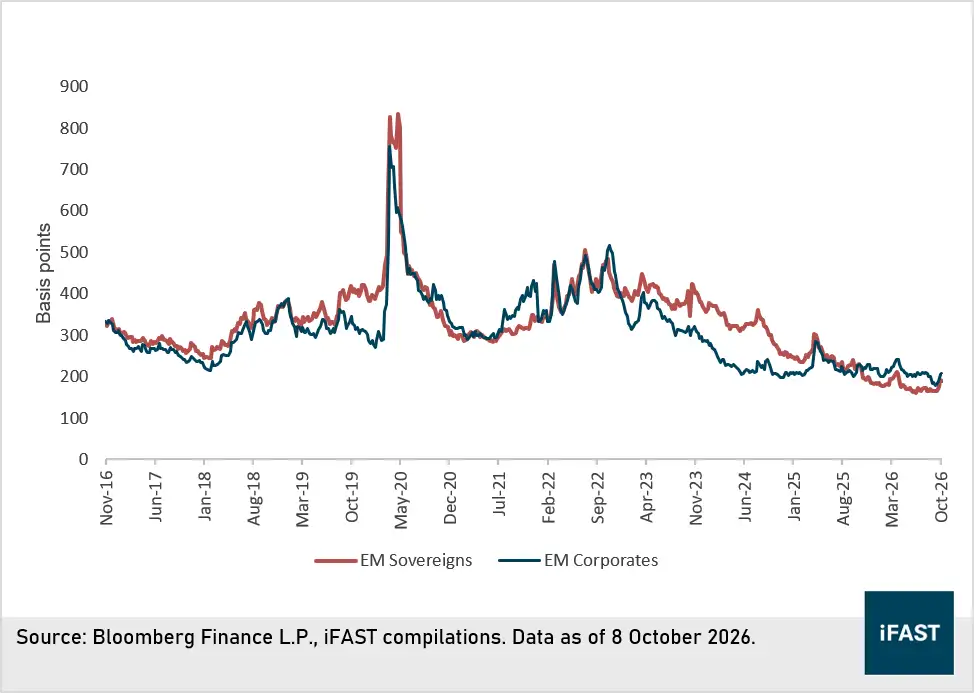
Chart
6: EM spreads vs 10-year average and 2022 peak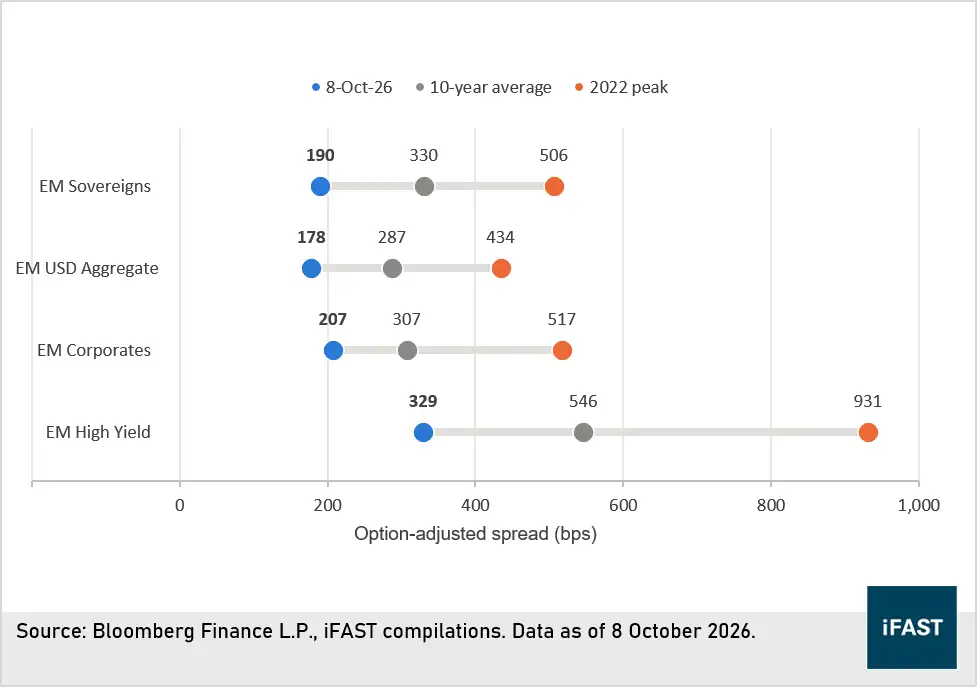
We acknowledge that conditions today differ from 2022. That cycle started from near-zero policy rates and took the Fed up by more than 400bps in a single year, whereas the Fed now starts at 3.75%–4.00%. Higher starting yields also give investors more income to absorb price losses.
However, that cushion mainly comes from Treasury yields, not from credit. With decade-tight spreads, investors are paid little for taking EM credit risk.
Hence, we feel that the risk is asymmetric. Upside from further spread tightening is limited when spreads are already at decade lows, while the downside from a repricing is not.
Conclusion
Our move to negative rests on one point: the current shocks leave neither segment of EM debt well protected. Local-currency debt faces re-accelerating inflation, led by energy and with El Niño a further risk to food prices into 2027, alongside weaker currencies and a stalled easing cycle. Hard-currency debt faces rising Treasury yields, budgets strained by costly subsidies, and spreads still close to decade lows that leave little room for these risks.
We acknowledge that EM fundamentals have improved and that higher starting yields give investors more income than in 2022. But at today’s spreads, investors are paid little for taking EM credit risk, and the improvement is uneven across a large and diverse universe.
We would turn more constructive if a combination of the following emerges: oil falls sustainably, the Fed signals a pause, El Niño’s impact on harvests proves milder than feared, and spreads widen enough to compensate for these risks.
Declaration: For specific disclosure, at the time of publication of this report, IFPL (via its connected and associated entities) and the analyst who produced this report holds NIL positions in the abovementioned securities.