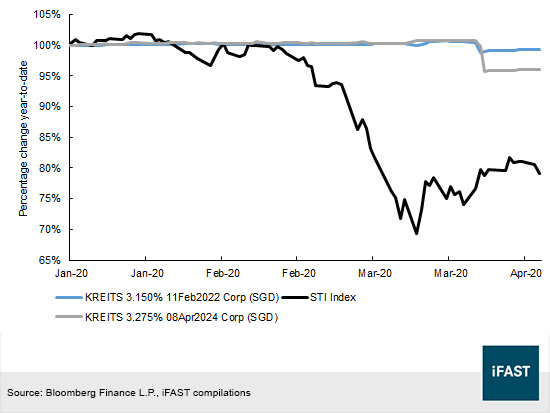
One benefit of owning individual fixed-income securities is illustrated in Figure 1. Keppel Real Estate Investment Trust’s (“Keppel REIT”) bonds would have helped mitigate portfolio losses from 2020’s market turmoil, if they were included in a diversified portfolio of bonds, stocks and other asset classes.
Keppel REIT’s bonds have outperformed the Straits Times Index (“STI”) year-to-date (“YTD”). The KREITS 3.150% 11Feb2022 Corp (SGD) and KREITS 3.275% 08Apr2024 Corp (SGD) were down 0.8% and 3.9% respectively, as compared to the 20.8% decline in the STI between end-2019 and 21 Apr 20. Singapore shares have declined in tandem with the global sell-off in light of the coronavirus pandemic, but Keppel REIT’s bonds appeared comparatively unscathed.
Figure 1: YTD percentage change in indicative ask bond prices vs STI Index
About Keppel REIT
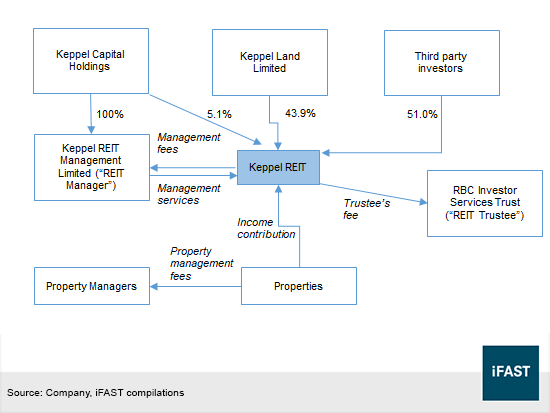
Keppel REIT is a real estate investment trust established by a trust deed between Keppel REIT Management Limited (the “REIT Manager”) and RBC Investor Services Trust Singapore Limited (the REIT Trustee). The REIT Manager is a wholly-owned subsidiary of Keppel Capital Holdings, the asset management arm of Keppel Corporation Limited (Figure 2). Keppel Land Limited is the REIT’s sponsor.
Like other REIT structures, Keppel REIT’s fixed expenses include fees paid to the REIT Manager, property management charges and trustee fees. During the past few years, Keppel REIT has been distributing 100% of its taxable income to unitholders, exceeding the 90% threshold set by the Inland Revenue Authority of Singapore (“IRAS”).
Figure 2: Keppel REIT’s organizational structure
Keppel REIT is a mid-sized trust among five other office REITs in Singapore. With S$7.45 billion of total assets, Keppel REIT is smaller than CapitaLand Commercial Trust (“CCT”), Mapletree Commercial Trust (“MCT”) and Suntec REIT, with respective total assets of S$10.19 billion, S$9.02 billion and S$10.03 billion. Frasers Commercial Trust (“FCT”) and OUE Commercial Trust (“OUECT”) manage assets of S$2.29 billion and S$6.89 billion respectively.
Table 1: Singapore Office REITS
|
REIT |
Location |
Properties |
|
CCT |
Singapore |
Capital Tower, Asia Square Tower 2, Capitagreen, Six Battery Road, One George Street, Raffles City Singapore, 21 Collyer Quay and CapitaSpring |
|
Germany |
Gallileo, Main Airport Center |
|
|
MCT |
Singapore |
VivoCity, Mapletree Business City, PSA Building, Mapletree Anson and Bank of America Merill Lynch HarbourFront |
|
Suntec REIT |
Singapore |
Suntec City retail, office and convention centre, One Raffles Quay, MBFC, 9 Penang Road |
|
Australia |
177 Pacific Highway, Southgate Complex, 55 Currie Street, 477 Collins Street |
|
|
FCT |
Singapore |
China Square Central, Alexandra Technopark |
|
Australia |
357 Collins Street, Caroline Chisholm Centre, Perth Central Park |
|
|
United Kingdom |
Famborough Business Park |
|
|
OUECT |
Singapore |
OUE Bayfront, One Raffles Place, OUE Downtown Office, Mandarin Gallery, Mandarin Orchard Singapore, Crowne Plaza Changi Airport |
|
China |
Lippo Plaza |
|
|
Keppel REIT |
Singapore |
Ocean Financial Centre, Marina Bay Financial Centre Towers, One Raffles Quay |
|
Australia |
8 Chifley Square, 8 Exhibition Street, 275 George Street, David Malcolm Justice Centre |
|
|
South Korea |
T Tower |
|
|
Source: Company filings, iFAST compilations |
||
Portfolio review
Keppel REIT’s portfolio assets under management dropped to S$7.9 billion at 31 Dec 19 from S$8.1 billion a year earlier, following the divestment of Bugis Junction Towers in November 2019 and the acquisition of T Tower in May 2019. Keppel REIT sold Bugis Junction Towers for a consideration of S$547.7m and recognized a net disposal gain of S$18.1m. T Tower is a freehold Grade A office building located in Seoul’s central business district that was purchased for KRW252.6 billion.
An overview of the portfolio in Table 2 shows that most of Keppel REIT’s portfolio (in terms of value) are located in Singapore, with high occupancy rates ranging between 97.8% and 100%. Many of the properties have gained in value since acquisition and we think the trust should be able to monetize these assets for liquidity requirements if needed.
Valuations of Singapore offices are likely to remain elevated. According to CBRE, capital values of Grade A Singapore offices have increased 1.7% YoY to S$3,000 per square feet (“psf”) at the end of 2019.
However, the assessed valuations of One Raffles Quay, 8 Chifley Square and 8 Exhibition Street in Keppel REIT’s portfolio declined due to potential occupancy changes and void periods. The REIT’s Australian properties were also affected by a lower AUD/SGD as the trust reports in Singapore dollars. The valuations of Australian properties have likely fallen further in 1Q20 because of the approximate 10% decline in AUD/SGD during the first quarter.
Table 2: Keppel REIT’s property portfolio
|
Property |
Ownership |
Purchase cost (on acquisition) |
Valuation on 31 Dec 19 |
Valuation on 31 Dec 18 |
Valuation gain since acquisition |
Occupancy rate as of 31 Dec 19 (%) |
|
Ocean Financial Centre |
79.9% |
S$1,838.6m |
S$2,099.8m |
S$2,099.0m |
S$261.2m |
99.2% |
|
Marina Bay Financial Centre -Towers 1 and 2, Marina Bay Link Mall |
33.3% |
S$1,426.8m |
S$1,695.3m |
S$1,695.3m |
S$268.5m |
98.9% |
|
Marina Bay Financial Centre Tower 3 |
33.3% |
S$1,248.0m |
S$1,297.0m |
S$1,297.0m |
S$49.0m |
98.9% |
|
One Raffles Quay |
33.3% |
S$941.5m |
S$1,254.3m |
S$1,275.6m |
S$312.8 |
97.8% |
|
8 Chifley Square, Sydney |
50.0% |
A$165.0m (S$197.8m) |
A$240.0m (S$222.2m) |
A$247.5m |
S$24.4m |
100.0% |
|
8 Exhibition Street, Melbourne |
50.0% |
A$168.8m (S$201.3m) |
A$265.3m (S$245.6m) |
A$270.0m |
S$44.3m |
100.0% |
|
275 George Street, Brisbane |
50.0% |
A$166.0m (S$209.4m) |
A$250.0m (S$231.4m) |
A$230.6m |
S$22.0m |
99.6% |
|
David Malcolm Justice Centre, Perth |
50.0% |
A$165.0m (S$208.1m) |
A$232.5m (S$215.2m) |
A$220.0m |
S$7.1m |
100.0% |
|
311 Spencer Street, Melbourne |
50.0% |
A$347.8m (S$362.4m) |
A$349.5m (S$323.5m) |
A$232.2m |
-S$38.9m (property under development) |
N.A. |
|
T Tower, Seoul |
99.38% |
KRW252.6 billion (S$292.0m) |
KRW259.0 billion (S$299.9m) |
S$7.9m |
100.0% |
|
|
Source: Company, iFAST compilations |
||||||
Income review
In line with dropping portfolio valuations, Keppel REIT’s total income exhibited a downward sloping trend. Total income contribution of the portfolio peaked at S$76.6m in 2Q18 but turned south afterwards on lower income from the Singapore offices. On a side note, income contribution is defined here as the effective net property incomes (“NPI”), rental support, interest, and dividend and distribution incomes from the REIT’s portfolio. These include contributions from One Raffles Quay Pte Ltd (“ORQPL”), BFC Development Limited Liability Partnership (“BFCDLLP”) and Central Boulevard Development Pte Ltd (“CBDPL”), which are the respective owners of One Raffles Quay, Marina Bay Financial Centre (“MBFC”) Towers 1 & 2 and Marina Bay Link Mall, and MBFC Tower 3.
Keppel REIT received lower NPI from Ocean Financial Centre, Bugis Junction Towers and 275 George Street during 2019. There was also less rental support for CBDPL, and lower contributions from ORQPL. The divestment of a 20% stake in Ocean Financial Centre (in December 2018) and Bugis Junction Towers likewise affected income last year.
Falling energy prices may adversely affect future income due to Keppel REIT’s exposure to the energy, natural resource, shipping and marine (“ERSM”) sectors. Nonetheless, these tenants contributed a yearly income of less than S$23m (Table 3), or less than 10% of total income. We think that the potential loss of rental income from ERSM is small as many of these tenants, such as Anglo American Marketing at Ocean Financial Centre and Queensland Gas Company at 275 George Street, are large companies with a high rental expense servicing ability.
Table 3: Energy company tenants
|
|
Committed monthly gross rent (%) of ERSM companies |
Estimated change in annual income if all ERSM tenants move out (S$ m) |
Estimated change in annual income if 50% of ERSM tenants move out (S$ m) |
|
Ocean Financial Centre |
14.2% |
-9.8 |
-4.9 |
|
Marina Bay Financial Centre -Towers 1 and 2, Marina Bay Link Mall |
9.6% |
-7.0 |
-3.5 |
|
Marina Bay Financial Centre Tower 3 |
9.6% |
-2.1 |
-1.0 |
|
One Raffles Quay |
1.2% |
-0.1 |
-0.1 |
|
8 Exhibition Street, Melbourne |
3.9% |
-0.4 |
-0.2 |
|
275 George Street, Brisbane |
31.8% |
-3.5 |
-1.7 |
|
Total impact on REIT |
-22.9 |
-11.4 |
|
|
Source: Company, iFAST estimates |
|||
Singapore office market
The prospect for Singapore offices, which accounted for 74% of Keppel REIT’s income (Figure 3), remains healthy. Commercial real estates in Singapore provided S$43.6m of the REIT’s income in the quarter ending 31 Dec 19 (“4Q19”), while Australian properties contributed S$11.9m.
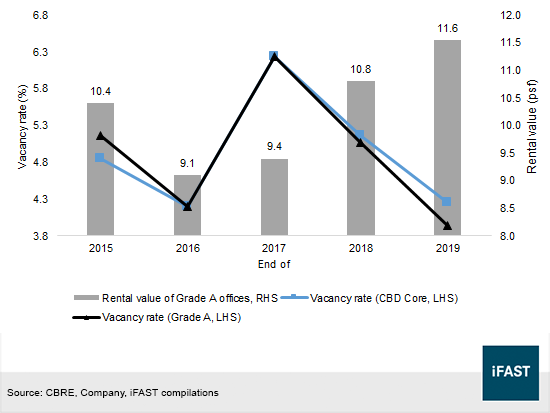
In the next few years, the supply pipeline for the Singapore market is set to tighten. Limited new Grade A office supply is expected to provide support to rental rates. Furthermore, Grade A vacancies is projected to remain stable until the end of 2021. CBRE forecasts average Grade A CBD Core rents (Figure 4) to hold steady at $11.55 psf this year, followed by a marginal decline to $11.50 psf in 2021.
Figure 3: Aggregate income contribution to Keppel REIT by country
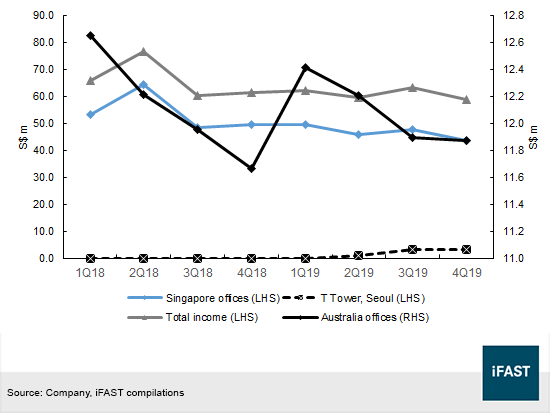
Figure 4: Singapore Grade A office vacancy rates and rental values
Australian and Korean commercial real estate
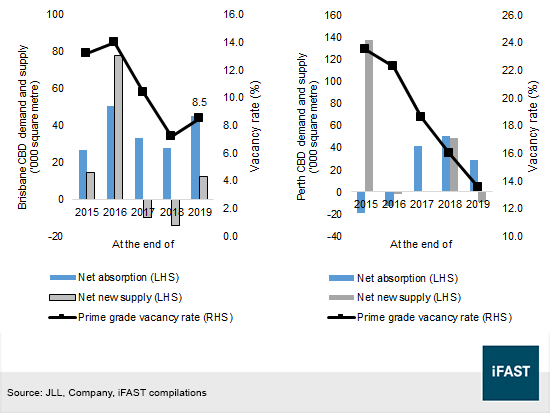
On the other hand, the prospect is somewhat mixed across Australian cities. Rising vacancy rates in the central business district of Sydney will likely weigh on property income in New South Wales, while strong buyer sentiment in Melbourne (Figure 5), recovering office demand in Brisbane and Perth should keep Keppel’s REIT income stable in these cities.
Sydney vacancies are anticipated to trend up heading towards 2021, with a supply cycle peak in 2022, when total office inventory is projected to top 114,500 square meters. CBD rental rates in Melbourne could increase or remain stable given the tight market conditions. Brisbane office rental rates may stabilize on a strong local economy, while Perth vacancy rates are likely to improve at a modest pace but remain at a heightened level north of 10% (Figure 6). That being said, commercial properties in Australia accounted for only 26% of Keppel REIT’s total income.
The performance of T Tower in Seoul held up well in 2019, as higher net absorption from improved leasing demand and limited supply in the Gangnam Business District pushed overall vacancies lower. Large Korean companies are relocating to the central business district, lifting demand for office spaces, although we think there growth in CBD rentals is likely to be marginal this year given the supply pressure.
Figure 5: Sydney and Melbourne CBD office demand and supply
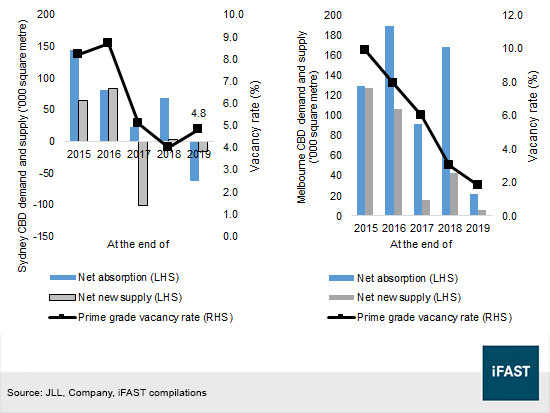
Figure 6: Brisbane and Perth CBD office demand and supply
Regulatory updates
On 16 Apr 20, Singapore’s Ministry of Finance (“MOF”), IRAS and Monetary Authority of Singapore (“MAS”) announced a few measures to help Singapore-listed REITs manage cash flow and raise capital, in the midst of a challenging business environment due to the virus pandemic. S-REITs will now have twelve months (previously three months) after the end of their financial year 2020 to comply with MOF and IRAS rules to distribute at least 90% of their taxable income. Keppel REIT currently distributes 100% of its taxable income to unitholders, so we think this regulatory change will not affect the REIT.
However, Keppel REIT will benefit from the announced funding and interest coverage flexibilities. MAS lifted the leverage limit for S-REITs from 45% to 50%, providing S-REITs with greater flexibility to manage their capital structure. In early April, the Singapore Exchange also expanded the share issue limit for Mainboard issuers from 50% to 100% of share capital.
Finally, REITs now have more time to meet the minimum interest coverage ratio requirement of 2.5 times (before they are allowed to increase leverage beyond the prevailing 45% limit). The minimum interest coverage deadline was extended to 1 Jan 22.
Financial discussion
Both Keppel REIT’s top line and bottom line increased in 4Q19. Property income grew from S$37.8m in 4Q18 to S$41.7m in 4Q19. After deducting property expenses of S$8.4m, NPI increased by 15.1% YoY to S$33.4m. Profits before gain on divestment and net change in fair value of investment properties increased 28.8% YoY to S$35.6m in 4Q19, and the REIT made a profit after tax of S$50.3m, down from a net profit of S$52.7m in 4Q18.
Net cash flow by operating activities was S$26.1m in 4Q19, up from S$19.2m a year ago. Including progress payment on properties under development and expenditures on investment properties, we estimated free cash flow at ~S$4.5m during the quarter.
Expenditures on properties may continue in 1Q20 as the 311 Spencer Street in Melbourne is presently under development. The cash burn will drop once the 30-year lease to the Victoria Police starts in 2Q20. 311 Spencer Street will be fully leased to the Minister for Finance – State of Victoria, and will serve as headquarters for the Victoria Police.
COVID-19 measures
Due to COVID-19, the outlook for 1H20 is dampened as commercial landlords are restricted in their ability in retrieving payments from tenants in Australia. As an example, landlords may not terminate leases due to non-payment of rent.
Tenants must be offered reduced rent of no less than 50% and up to 100% of the amount payable, depending on the reduction in the tenant’s business. In addition, tenants should be provided with an opportunity to extend the lease for an equivalent period of rent waiver. Landlords also may not apply any penalties if tenants reduce operating hours.
In Singapore, Keppel Land and Keppel REIT announced that they will pass on the 30% property tax rebate from the Singapore Resilience Budget to its office tenants. Retail tenants such as those in Marina Bay Link Mall will receive 100% property tax rebate savings over April and May. Up to 30% of rental rebates will also be provided to eligible retail tenants in May and June to tide them through the virus outbreak. These measures are in addition to reliefs that were implemented in March, including allowing tenants to use their one-month security deposit to offset rental payment, and deferring the rent due in March for certain retail tenants.
Credit and liquidity metrics
Our estimate of Keppel REIT’s EBITDA was S$50.9m for the fourth quarter. This was arrived after adjusting profit for interest expenses, taxes, depreciation, amortisation, divestment gain and changes in property fair values. When expressed as a multiple of interest expense, Keppel REIT’s interest coverage was ~3.3x for 4Q19. This places the trust in a weaker position than FCT, CCT, MCT and Suntec REIT in terms of its ability to cover financing costs (Table 4).
Gearing – measured by the percentage of total debt (including perpetual securities) to total assets – was lower than MCT, Suntec REIT and OUECT at the end of December. However, if gearing is measured as net debt over EBITDA instead, Keppel REIT would have the highest debt multiple among peers at 10.6x.
In spite of the relatively high EBITDA gearing and low interest coverage ratios, Keppel REIT still has an ample liquidity profile. As at 31 Dec 19, the trust’s ratio of cash to short-term borrowings was second to CapitaLand Commercial Trust, at 124.9%.
The trust may also access S$989.0m of unutilized credit facilities to meet contractual obligations. In an exchange filing on 27 March, the REIT manager disclosed that it had obtained a S$100m loan facility. It is also noteworthy that Temasek Holdings has a deemed interest of 49.8% in the REIT through its shareholding in Keppel Corp.
Keppel REIT has a diversified tenant base. As at 31 Dec 19, top ten tenants accounted for 37.8% of the REIT’s total net lettable area and 34.4% of gross rents. One minor downside is that 41.8% of committed monthly gross rents are earned from tenants in the banking and financial services sector, but we think this is a small concern as financial institutions in Singapore are mostly in good financial condition. And we do not foresee foreign or local banks moving their operations out of Singapore or Australia.
Overall, we think that Keppel REIT has healthy credit metrics with a good liquidity profile. The REIT’s office properties are well positioned in premier markets within the central business districts of Singapore and Australia. Although rental rates may weaken in the near term, only 10.8% of rental leases are expiring in 2020.
Table 4: Credit performance of Keppel REIT and peers
|
|
Cash / Short term borrowings |
EBITDA / interest expense |
Total debt / total assets |
Net debt / EBITDA |
|
CCT |
480.7% |
4.8x |
27.6% |
7.6x |
|
MCT |
26.0% |
4.4x |
33.4% |
7.9x |
|
Suntec REIT |
26.7% |
4.9x |
36.2% |
6.5x |
|
FCT |
8.3% |
3.8x |
29.0% |
8.7x |
|
OUECT |
10.3% |
3.1x |
39.0% |
9.4x |
|
Keppel REIT |
124.9% |
3.3x |
30.5% |
10.6x |
|
Source: Company filings, iFAST estimates |
||||
Bond valuation
In view of its decent financial strength and adequate liquidity measure, we think that the bonds of Keppel REIT are attractively priced (Figure 7). The KREITS curve is higher than other Singapore office REIT credits, probably due to the weak AUD/SGD, landlord restrictions in Australia and recent work-from-home social distancing measures.
We prefer the KREITS 4.980% Perpetual Corp (SGD) over the KREITS 3.150% 11Feb2022 Corp (SGD) and KREITS 3.275% 08Apr2024 Corp (SGD). The KREITS 3.15% ‘22s and KREITS 3.275% ’24s are small-sized bonds with outstanding amounts of S$50m and S$75m respectively. Given current market liquidity, we think investors would likely have to incur a liquidity premium when investing in these notes, and it is for this reason we are not recommending the two notes.
If not called on 20 Nov 20, the KREITS 4.98% perp will reset to the prevailing 5-year SGD swap offer rate (“SOR”) + 270.5 basis points. We believe that the issuer is likely to redeem the S$150m perpetual, even though the 5-year SGD SOR is trading a low level of around 0.78%. As at 22 April, the KREITS 4.98% perp had an indicative yield to next call of 5.6%. We think Keppel REIT is still able to tap the bond market to refinance the perp, or opt for an equity fund raising exercise if needed.
Figure 7: Relative valuation
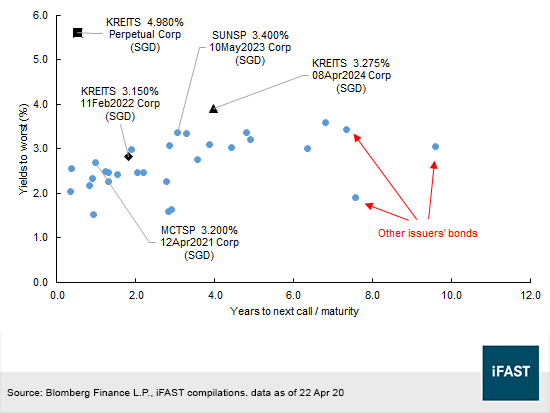
The SUNSP 3.400% 10May2023 Corp (SGD) and MCTSP 3.200% 12Apr2021 Corp (SGD) are priced towards the higher end among office REIT credits, but we are not keen on the SUNSP 3.4% ‘23s. Referring to our previous report in December (“Suntec REIT: Should bond investors rely on the Fountain of Wealth in 2020?”), we maintained that Suntec REIT has a riskier credit profile.
In conclusion, Keppel REIT offers significant exposure to the Grade-A Singapore office sector, where rental rates will likely remain at a high level. In the first half of 2020, the REIT will be impacted by the loss of income from the fit-out work period related to HSBC’s move into MBFC Tower 2. But this is likely to be offset by positive contributions from T Tower and 311 Spencer Street. The KREITS bonds are attractive as the liquidity profile of the trust is healthy. Investors should take advantage of any sell-offs in the bonds as buying opportunities for the long term.
Declaration:
For specific disclosure, at the time of publication of this report, IFPL (via its connected and associated entities) and the analyst who produced this report hold a NIL position in the abovementioned securities.