• Record core earnings: Gross profit rose 21.6% YoY to USD 3.2 billion, and adjusted EBITDA jumped 47.4% YoY to a record USD 1.2 billion, and management raised its FY26 guidance for a third time this year.
• Twin operating engines firing on all cylinders: Cash App gross profit rose 27% YoY and Square’s ecosystem gross profit rose 14% YoY, with Neighbourhoods funnelling Square shoppers into Cash App.
• Improving credit profile: Net cash continues to pile up as gross leverage declines while interest coverage remains strong.
• About the bonds: We continue to like Block's 5.7% to 6.2% intermediate-tenor USD bonds (rated BB+ by S&P, BBB- by Fitch and Ba1 by Moody's) for investors seeking a yield pickup over higher-rated peers.
We initiated coverage on Block's bonds earlier this year and have since updated on its first two quarters. Block has now reported for the third quarter ending 30 September 2026 (3Q26). As before, we measure leverage and coverage on a trailing twelve-month (TTM) basis, and free cash flow (FCF) is operating cash flow (OCF) less capital expenditure (capex).
Related articles:
Idea of the Week: The missing Block for your US Fixed-Income portfolio
Credit Update: Block’s increasing profitability for 1Q26 makes its USD 5+% bonds even more appealing
Credit Update: A record 2QFY2026 and a shift to net cash keep us positive on Block’s USD 5+% bonds
Core Profitability Hit Another Record, but Headline Net Income Tells a Messier Story
Headline revenue rose 9.9% YoY to USD 6.7 billion (3Q25: USD 6.1 billion). Excluding bitcoin, revenue grew 20.1% YoY to USD 4.9 billion. Bitcoin revenue fell 10.7% YoY to USD 1.8 billion, but as it makes up only 2% of gross profit, we continue to leave the segment out of our credit assessment. The cleaner gauge, gross profit, rose 21.6% YoY to USD 3.2 billion, and gross margin widened to 48.1% (3Q25: 43.5%).
Operating expenses rose 24.6% YoY to USD 2.8 billion, largely on two items. The first is USD 435 million of contingencies, restructuring and other charges (3Q25: USD 21 million), driven mostly by legal accruals. The biggest legal matter is the DOJ’s anti-money laundering probe. In October, Block agreed in principle to settle it through a three-year deferred prosecution agreement, with a net payment of about USD 764 million, now fully accrued. We note the final bill could be higher, as the terms are not final. That said, we see no damage to the franchise thus far, with Cash App’s monthly actives at a record 60 million. The second is a 65.6% YoY rise in transaction, loan and consumer receivable losses to USD 601.7 million, as fast lending growth requires the booking of upfront reserves by accounting standards. Partly offsetting these increases, product development costs fell 10.6% YoY to USD 635.6 million, as February’s job cuts lowered staff costs.
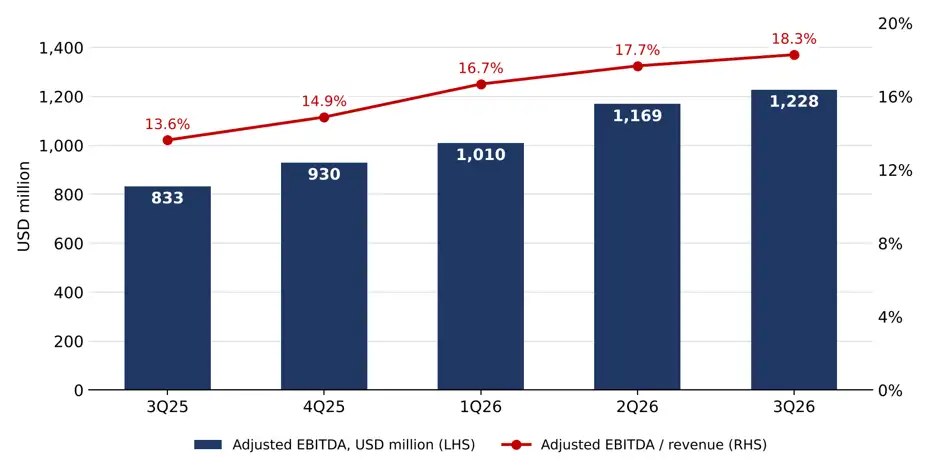
Strip out this noise and core profitability keeps building. Adjusted EBITDA, our preferred gauge because it excludes non-cash items and one-off charges, rose 47.4% YoY to a record USD 1.2 billion (3Q25: USD 833 million), and the margin (adjusted EBITDA / revenue) widened to 18.3% (3Q25: 13.6%) (see Chart 1 below). Building on this, management raised its FY26 guidance again, now expecting USD 12.6 billion of gross profit (+22% YoY) and USD 3.5 billion of adjusted operating income. For 2027, it guides for gross profit growth of at least 15% and adjusted operating income of USD 4.6 billion (+30% YoY), which it says will come as Block "expands margins while still investing meaningfully to sustain long-term growth."
Chart 1: Adjusted EBITDA Set Another Record, With Margins Widening Every Quarter
Data as of 30 September 2026
Source: Company data, iFAST compilations.
Net income tells a messier story, which is why we do not lean on it. Net income attributable to shareholders rose 22.5% YoY to USD 566 million (3Q25: USD 462 million), but this included a USD 229.7 million gain from marking Block's bitcoin holdings to market (3Q25: USD 59.6 million). That paper gain made up more than a third of pre-tax income of USD 612.5 million and could easily reverse. As bondholders, we therefore focus on adjusted EBITDA; on that metric, we are pleased with the increasing core profitability displayed by Block over the past four quarters, supporting its debt-servicing capacity.
Both Ecosystems Grew, With Lending Still Doing the Heavy Lifting
Cash App gross profit rose 27% YoY to USD 2.1 billion. Monthly transacting actives reached a new high of 60 million, while primary banking actives (customers using Cash App as their main bank account) grew 13% YoY to 9.4 million. As we noted previously, these customers generate 10x the gross profit of users who only send peer-to-peer payments, so their growth should support both earnings and margins. Lending again did much of the work, with consumer lending originations up 40% YoY to USD 19.0 billion, led by Cash App Borrow and Afterpay Post-Purchase.
Square gross profit rose 14% YoY to USD 1.2 billion, matching growth in gross payment volume (GPV) to USD 76.4 billion, the fastest pace since 1Q23. This matters because merchant payments are less exposed to consumer credit than Cash App lending, so a faster-growing Square improves the quality of Block's earnings. The seller base is also shifting upmarket, with mid-market sellers (over USD 0.5 million in annualised GPV) again growing fastest as Block pushes into larger chains. In our view, larger sellers tend to be more resilient in a downturn, which should make Square’s volumes steadier.
Building on this, Neighbourhoods, Block’s loyalty and rewards network, is starting to link the two ecosystems. It connects Square sellers with Cash App users, and sellers on it now represent nearly USD 5.0 billion in annualised GPV, almost 5x June’s level. Management credits it as a key driver of Cash App, reaching 60 million monthly actives. That said, it is still early, and we would watch whether these new users stay active.
Crucially for bondholders, the fast-lending growth has not yet shown up as weaker loan quality. Management said that "Borrow risk loss rates remained healthy” and that it expects "YoY growth in transaction, loan, and consumer receivable losses to moderate further in the fourth quarter." It also noted that "every annual Square loan cohort has performed in line with or better than our 4% loss target." We would qualify this, however. Cash App serves many lower-credit customers, and management plans to raise Borrow limits again, so we will watch whether loss rates hold as limits rise.
Cash Flow Remains Healthy, further Strengthening Block’s Net Cash Pile
OCF fell 30.0% YoY to USD 1.0 billion (3Q25: USD 1.5 billion), and after USD 44 million of capex, FCF fell 30.6% YoY to USD 972 million. We would not read this as weakness, as 3Q25 was an unusually strong quarter that alone made up more than half of FY25 OCF. In 2026, OCF held steady at about USD 1.0 billion each quarter (1Q26: USD 966 million; 2Q26: USD 1.0 billion). Cash conversion (FCF / adjusted EBITDA) was 79% in 3Q26 (2Q26: 83%), close to 80% on a TTM basis, whereas 3Q25’s 168% was well above normal.
Liquidity strengthened further. As of 30 September 2026, unrestricted cash and short-term investments stood at USD 8.2 billion (2Q26: USD 6.7 billion). With the undrawn USD 900 million revolving credit facility, total available liquidity stands at USD 9.1 billion. Against USD 5.7 billion of borrowings, Block's net cash position more than doubled to USD 2.5 billion (2Q26: USD 1.0 billion). Even after adjusting for the net payment of about USD 764 million for its DOJ legal settlement, Block would still hold net cash of about USD 1.8 billion.
Gross leverage Fell Again and Coverage Ticked Up
With gross debt flat at USD 5.7 billion and TTM adjusted EBITDA up to USD 4.3 billion, gross leverage (gross debt / TTM adjusted EBITDA) eased to 1.32x compared to 2Q26’s 1.45x (see Table 1 below). Interest coverage (TTM adjusted EBITDA / TTM net interest expense) edged up to 20.6x (2Q26: 20.0x), as quarterly net interest expense fell to USD 48.1 million (2Q26: USD 55.7 million), likely helped by the notes repaid in 2Q26.
On balance, we expect leverage to keep falling and coverage to build from about 20x, as adjusted EBITDA grows. Management’s guidance for 30% growth in adjusted operating income in 2027 supports this view. A larger-than-expected DOJ payment or a return to large share buybacks, which totalled USD 700.9 million in 1H26 but paused in 3Q26, could see leverage pickup. That said, with a healthy net cash balance, we do not expect any material worsening of Block’s credit profile.
Table 1: Leverage Keeps Falling, With Comfortable Coverage
|
Credit metrics |
2Q26 |
3Q26 |
|
Gross leverage (gross debt / TTM adjusted EBITDA) |
1.45x |
1.32x |
|
Interest Coverage (TTM adjusted EBITDA / TTM net interest expense) |
20.0x |
20.6x |
|
Data as of 30 September 2026 Source: Company Data, iFAST Compilations. |
||
Recommendations
Overall, we think Block’s credit profile remains solid and continues to improve, given record core earnings, a growing net cash position and healthy coverage. We continue to think adjusted EBITDA and cash flows should trend higher as Cash App and Square deepen their integration. That said, we continue to highlight the risks of rising lending losses should the US consumer weaken. However, we believe Block’s net cash position and coverage of about 20.6x should not result in a material impairment of its credit standing.
Block’s outstanding bonds trade at a yield-to-worst range of 5.74% to 6.29%, with expected tenors ranging from 0.51 years to 6.77 years (see Table 2 below). Against comparable US Treasuries, these issues provide a yield spread of 108bps to 154 bps. When compared to close industry peers Fiserv and PayPal, Block’s bonds provide a yield pickup of 3bp to 79bp for similar tenors. We recommend the XYZ 6.500% 15May2032 Corp (USD) issue as it offers the widest pickup and the highest coupon. Note: Both Fiserv (BBB by S&P) and PayPal (A-) have higher credit ratings than Block.
Investors looking for higher yields from an issuer that is displaying an improvement in credit profile can consider these medium-tenor bonds from Block.
Table 2: Block's USD Bonds Against Payments Peers
|
Issue |
Issuer |
Ask Price |
Yield to Worst (%) / Yield to Next Call (%) |
Years to Maturity / to next call |
Credit Rating ( S&P / Fitch / Moody’s) |
|
Block Inc. |
91.12 |
5.74% / 5.87% |
4.56 / 4.31 |
BB+ / BBB- / Ba1 |
|
|
Block Inc. |
100.89 |
6.11% / 11.04% |
5.51 / 0.51 |
BB+ / BBB- / Ba1 |
|
|
Block Inc. |
98.39 |
6.29% / 8.61% |
6.77 / 1.76 |
BB+ / BBB- / Ba1 |
|
|
FISV 5.350% 15Mar2031 Corp (USD) |
Fiserv |
98.62 |
5.71% / 5.73% |
4.35 / 4.18 |
BBB / - / Baa2 |
|
FISV 5.600% 02Mar2033 Corp (USD) |
Fiserv |
98.36 |
5.91% / 5.93% |
6.31 / 6.06 |
BBB / - / Baa2 |
|
PYPL 4.400% 01Jun2032 Corp (USD) |
PayPal |
95.64 |
5.32% / 5.36% |
5.56 / 5.31 |
A- / A- / A3 |
|
PYPL 5.150% 01Jun2034 Corp (USD) |
PayPal |
96.97 |
5.65% / 5.66% |
7.56 / 7.31 |
A- / A- / A3 |
|
Data as of 10 November 2026 Source: Bloomberg, Bondsupermart, iFAST Compilations. |
|||||
Declaration: For specific disclosure, at the time of publication of this report, IFPL (via its connected and associated entities) holds a position in XYZ 6.500% 15May2032 Corp (USD) and the analyst who produced this report holds NIL positions in the abovementioned securities. This research report was prepared with the assistance of artificial intelligence (AI) tools. iFAST Financial Pte Ltd does not rely exclusively on AI for content generation; the content of this report – including all investment theses, ratings, price targets and conclusions – has been independently reviewed and verified by the research analyst(s) to ensure accuracy and professional integrity.