The virus pandemic has changed much of how people consume food. With social-distancing measures in place, consumers are dining at home, even hoarding groceries. The demand for food ingredients, driven by more sales of packaged-foods may paint a positive outlook for agriculture-centric companies.
About Olam
Olam International Limited (“Olam”) is a large food and agribusiness company providing food, ingredients, feed and fibre to over 25,000 customers worldwide. It is one of the largest 30 companies on the Singapore Exchange by market capitalization. As of 2019, the company recognized principal activities in four reporting segments – 1) edible nuts and spices; 2) confectionery and beverage ingredients; 3) food staples and packaged foods; 4) industrial raw materials, infrastructure and logistics; and 5) commodity financial services. Each reporting segment is made up of a few businesses shown in Table 1.
Table 1: Olam’s businesses
| Business segment | Sub-business |
| Edible nuts and spices | 1. Edible nuts (cashew, peanuts, almonds, hazelnuts, pistachios, walnuts, sesame, pulses and beans) |
| 2. Spices (pepper, onion, garlic, capsicums, tomato and chilies) | |
| Confectionery and Beverage Ingredients | 3. Cocoa |
| 4. Coffee | |
| Food staples and packaged foods | 5. Rice |
| 6. Sugar and sweeteners (divesting) | |
| 7. Grains and animal feed & proteins | |
| 8. Edible oils | |
| 9. Dairy | |
| 10. Packaged foods | |
| Industrial raw materials, infrastructure and logistics | 11. Cotton |
| 12. Wood products (divesting) | |
| 13. Rubber (divesting) | |
| 14. Fertilizer (divesting) | |
| 15. Infrastructure and logistics | |
| Commodity financial services (CFS) | 16. Funds management |
| Source: Company, iFAST compilations | |
Olam 2.0
Last year, Olam announced a company reorganization plan to meet the evolving needs of consumers. The new structure will have two distinct groups – Olam Food Ingredients (“OFI”) and Olam Global Agri (“OGA”) – with both subsidiaries held by the parent entity, Olam International Limited. OFI and OGA will each oversee sub-operational units with new business strategies laid out in Table 2.
As part of the reorganization process, the agribusiness corporation will be deprioritising and exiting four businesses that are no longer central to Olam’s business plan (Sugar, Rubber, Fertiliser and Wood). To provide more clarity on the final operational and financial structures, Olam will be reporting key operating metrics in August, and highlight the possibility for a carve-out and initial public offering within the following 18-24 months.
Table 2: New group structure
|
Parent company |
Entity |
Sub-business unit |
Business unit strategy |
|
Olam International Limited |
OFI |
Cocoa |
To become an integrated cocoa ingredient company with solutions to worldwide customers. |
|
Coffee |
Maintain global leadership in green coffee and expand the soluble coffee business. |
||
|
Edible Nuts |
Maintain global leadership and expand Almonds & Pistachios upstream, ingredients and co-manufacturing opportunities. |
||
|
Spices |
Grow the onion, garlic, tropical spices in origin countries. Invest in midstream spice processing capabilities. |
||
|
Dairy |
Enlarge dairy farming in Russia and midstream footprint. |
||
|
OGA |
Grains |
Develop flour milling in Western Africa and animal feed operation. Maintain an asset light global trading business. |
|
|
Animal Feed & Protein |
|||
|
Edible oils |
Improve yield and cost efficiencies in upstream palm oil and invest in midstream operations. |
||
|
Rice |
Continue to build on Asian origination and African distribution capabilities. |
||
|
Cotton |
Retain global leadership and grow ginning and farming presence. |
||
|
Commodity Financial Services |
Focus on quantitative strategies and risk management solutions. |
||
|
Source: Company, iFAST compilations |
|||
Ample sources of liquidity available to the firm
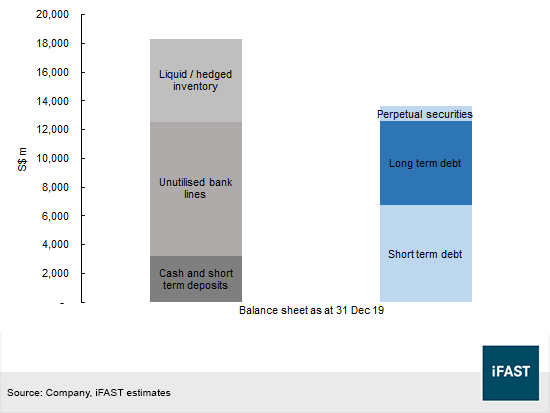
Olam has access to sufficient sources of liquidity and we believe that the group has the financial capacity to pay off its financial obligations. Olam had access to S$9.4 billion of undrawn credit lines, S$3.2 billion of cash and short-term deposits, and S$5.7 billion of inventory that may be divested for liquidity (Figure 1). Collectively, the combined value of these assets exceeded the total borrowings and issued perpetual securities of the agribusiness conglomerate.
In a more recent development, the agricultural corporation announced on 29 April that it had obtained a USD 176m term loan from the International Finance Corporation and Japan International Corporation Agency. Proceeds from the facility, consisting of a 5-year USD 120m term loan and 7-year USD 56m term loan, will be used to purchase agriculture commodities from farmers in developing countries and expand the cocoa processing facility in Indonesia.
Figure 1: Value of liquid assets and borrowings
Institutional support
Secondly, we are inclined to think that Olam will enjoy some form of financial support in times of need, with Temasek Holdings as a shareholder in the company. As at the end of 2019, Temasek held a 53.6% deemed interest in Olam through its indirect wholly-owned subsidiaries, Breedens Investments Pte Ltd and Aranda Investments Pte Ltd.
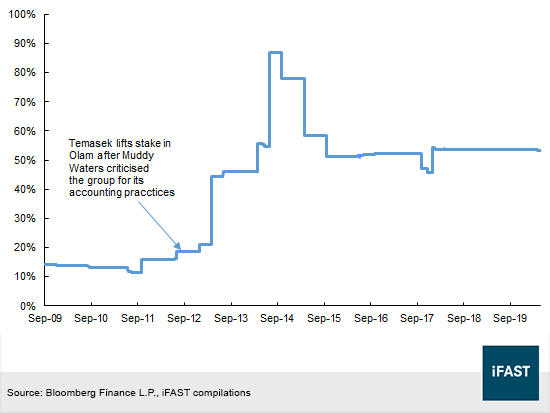
When Olam was accused of questionable accounting practices in 2012 by short seller Muddy Waters, Temasek increased its equity stake in the group to ~24% (Figure 2). In March 2014, the sovereign entity became the largest shareholder with a ~58% interest after it made a larger offer for the company’s shares. To distribute products in the Japanese market, a strategic partnership was formed with Mitsubishi Corporation in August 2015. Mitsubishi became a 20% equity holder through a private placement and secondary share acquisition, which diluted Temasek’s stake to 51.4%.
Figure 2: Temasek’s shareholding in Olam
Large operational scale with diversified geographic exposures
Olam is a large company with a presence in more than 60 countries. In 2019, Olam made S$33.0 billion of revenue on a 20.9% YoY increase in volume, which was largely a result of high grains trading activity in the Food Staples & Packaged Food division.
Geographically, Asia, Middle East & Australia (“AMEA”) accounted for 49.7% of 2019 revenue. AMEA revenue grew from S$6.8 billion in 2016 to S$16.4 billion in 2019, representing a compounded annual growth rate of 34%. Last year, the group also derived S$4.5 billion, S$6.6 billion, and S$5.5 billion of revenue from Africa, Europe, and the Americas respectively.
Figure 3: Revenue by region
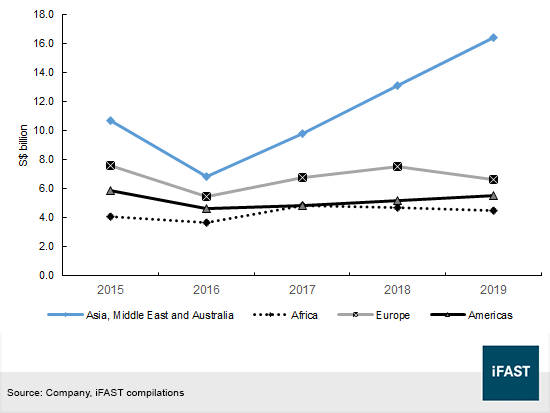
Olam’s geographical diversity reduces the firm’s exposure to adverse regional or vendor-specific developments that could lead to supply disruptions, demand shifts and price fluctuations. As it stands, the firm is working to minimize potential interferences to the supply chain in light of the virus pandemic, but the extent of any loss will be revealed in its 1H20 reporting later this year.
Consistently positive EBITDA
Coinciding with higher revenue in 2019, Olam recorded S$1.5 billion of total EBITDA last year. EBITDA contributions were broadly positive across segments (Table 2). As a matter of fact, the group had been generating EBITDAs north of S$1 billion since 2014, which pointed to a healthy cash-flow generating ability. The best-performing segment – confectionery and beverage ingredients – delivered S$562m of EBITDA from S$6.7 billion of revenue, translating to an EBITDA margin of 8.4%.
Table 2: EBITDA by reporting segment
|
Figures in S$m |
2014 |
2015 |
2016 |
2017 |
2018 |
2019 |
|
Edible nuts and spices |
361 |
394 |
332 |
438 |
340 |
342 |
|
Confectionery and beverage ingredients |
276 |
284 |
407 |
328 |
444 |
562 |
|
Industrial raw materials, infrastructure and Logistics |
216 |
185 |
135 |
197 |
176 |
174 |
|
Food staples and packaged foods |
295 |
212 |
330 |
360 |
289 |
455 |
|
Commodity financial services |
-18 |
11 |
-2 |
5 |
-13 |
19 |
|
Total EBITDA |
1,129 |
1,085 |
1,203 |
1,328 |
1,236 |
1,552 |
|
Source: Company, iFAST compilations |
||||||
Olam’s ability to service interest is decent. EBITDA over interest expense was 2.5x in 2019, up from 2.3x in 2018. Gearing, measured by net debt over EBITDA, stayed relatively high but dropped from 7.9x to 6.7x in the same period. Free cash flows, defined as net operating cash flow (“CFO”) minus capital expenditures, remained positive at S$756.4m in 2018 and S$108.9m in 2019.
To put the performance in the perspective of its peers, Olam’s credit profile is somewhat weaker than other agricultural merchants, with a higher gearing and lower interest servicing ability (Table 3). Bunge Limited and Archer Daniels Midland Company (“ADM”) are publicly traded firms in the US, while Louis Dreyfus Company (“LDC”) is an established agricultural trader with a portfolio covering the entire food value chain. ADM and Bunge are larger companies in terms of revenue as compared to LDC and Olam.
Like Olam, LDC has a high gearing metric, but has better debt and interest coverage ratios. However, LDC may be affected by the company’s exposure to Luckin Coffee after the two parties signed an alliance last year. In 2019, LDC recognized fair value gains of USD 63m from its investments in Chinese coffee chain, which could be written down this year.
ADM has the strongest credit strength among the four companies, with a 7.4x interest multiple and low 31.6% debt-to-total capital ratio. Bunge, on the other hand, reported negative EBITDA as the company made a loss of USD 1.3 billion during 2019, as a result of lower operating profit primarily in its sugar and bioenergy businesses, where a charge of USD 1.7 billion was recognized associated with the sale of sugar and bioenergy operations in Brazil.
Table 3: 2019 credit performance vs peers
|
Competitors |
Revenue (USD m) |
EBITDA / Interest |
CFO / Debt |
Debt / Total capital |
Net debt / EBITDA |
|
Bunge |
41.1 |
N.M |
N.M |
45.3% |
N.M |
|
LDC |
33.6 |
2.9x |
12.1% |
83.1% |
6.7x |
|
ADM |
64.7 |
7.4x |
N.M |
31.6% |
2.7x |
|
Olam |
24.5 |
2.5x |
5.1% |
67.6% |
6.7x |
|
Source: Company filings, iFAST estimates |
|||||
First quarter outlook
We expect sales to fall during the first quarter of 2020 as prices of agricultural commodities have generally weakened across the board (Table 4). Sugar and cotton prices decreased significantly by 22.4% and 26% respectively in the first quarter. Cotton futures decreased due to a meaningful drop in retail textiles sales. Olam has announced that the company will be divesting its sugar business with the sale of the remaining 50% stake in Indonesian sugar joint venture, Far East Agri.
Food staples and packaged food revenue could witness a large pullback in 1Q20 as the underlying agriculture benchmarks in rice, sugar, corn, soybean meal (which is mainly used in animal feed), palm oil and milk have declined. Restaurant closures and the lower demand for cheese have brought down milk prices, forcing farmers to liquidate excess inventory. Country lockdowns have lowered demand for corn and ethanol, which led to a fall in corn futures.
While some countries like China and the US are starting to reopen their economies, others such as India remain in lockdown. Reopening the economy will lift consumption, but these demand-and-supply imbalances are likely to persist for at least some time, leaving supply chains in disarray. Until we have a clear outlook for long-term predictable demand, farmers will have a difficult time forecasting crop demand for the next season and agriculture prices may remain volatile.
Table 4: Agriculture commodity prices
|
Benchmark description |
Price quotation |
End of 2017 |
End of 2018 |
End of 2019 |
31 March |
1Q20 change |
|
China Agricultural wholesale onion prices |
CNY / kilogram |
2.2 |
2.3 |
3.4 |
3.0 |
-11.8% |
|
China Agricultural wholesale garlic prices |
CNY / kilogram |
7.5 |
6.0 |
10.1 |
10.3 |
2.0% |
|
NNS Delhi almonds |
INR / 40 kilograms |
17,250 |
18,550 |
18,700 |
17,450 |
-6.7% |
|
NNS Peshawari Pistachios |
INR / kilograms |
1,580 |
1,690 |
2,525 |
2,625 |
4.0% |
|
ICE generic 1st month cocoa futures |
USD / Metric tons |
1,892 |
2,416 |
2,540 |
2,249 |
-11.5% |
|
ICE generic 1st month coffee futures |
USD / lbs |
126.2 |
101.9 |
129.7 |
119.3 |
-8.0% |
|
CBOT generic 1st month rough rice futures |
USD / centum weight |
11.7 |
10.1 |
13.1 |
14.0 |
6.9% |
|
ICE generic 1st month sugar futures |
USD / lbs |
15.2 |
12.0 |
13.4 |
10.4 |
-22.4% |
|
CBOT generic 1st month corn futures |
USD / bushel |
350.8 |
375.0 |
387.8 |
340.8 |
-12.1% |
|
CBOT generic 1st month soybean meal futures |
USD / ton |
312.6 |
306.2 |
299.9 |
321.5 |
7.2% |
|
Bursa Malaysia generic 1st month palm oil futures |
MYR / Metric Tons |
2,444 |
2,004 |
3,041 |
2,550 |
-16.1% |
|
ICE generic 1st month cotton futures |
USD / lbs |
78.6 |
72.2 |
69.1 |
51.1 |
-26.0% |
|
CME generic 1st month milk futures |
USD / centum weight |
15.4 |
13.8 |
19.3 |
16.2 |
-16.1% |
|
Source: Bloomberg Finance LP, iFAST compilations |
||||||
High cash conversion cycle
Due to the inherent nature of the agricultural business, Olam has a high albeit improving cash conversion cycle of 70 days (Table 5). The firm alluded the improvement to the increase in bulk trading volumes and better access to supplier credit.
Agriculture traders face specific risks linked to biological- and weather-related factors, commodity price volatility, rural area infrastructure, and government trade policies, which may have a meaningful impact on profitability. With a significant customer base in frontier markets, striving for low counterparty risk, well-developed logistics and good working capital management are crucial to Olam’s credit outlook. The group’s ability to convert working capital to cash has been improving, but we will continue to monitor its cash-conversion ability as an indicator of potential credit weakness.
Table 5: Cash conversion cycle
|
Days
|
2014
|
2015
|
2016
|
2017
|
2018
|
2019
|
|
Stock
|
110
|
143
|
147
|
93
|
84
|
87
|
|
Advance
to suppliers
|
14
|
15
|
17
|
11
|
10
|
6
|
|
Receivables
|
27
|
28
|
29
|
26
|
29
|
25
|
|
Trade
creditor
|
-30
|
-37
|
-43
|
-33
|
-47
|
-48
|
|
Cash
cycle
|
121
|
149
|
150
|
97
|
76
|
70
|
|
Source: Company, iFAST compilations
|
||||||
Bond valuation
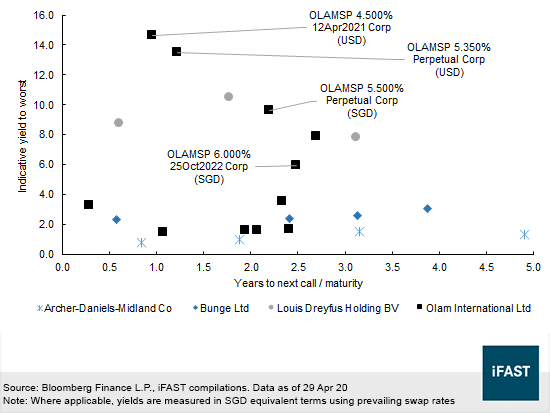
Given its easy access to liquidity and good cash-flow generating ability, we think that Olam’s bonds are attractively priced among global agribusiness credits. We like the OLAMSP 4.500% 12Apr2021 Corp (USD), OLAMSP 5.350% Perpetual Corp (USD), OLAMSP 5.500% Perpetual Corp (SGD) and OLAMSP 6.000% 25Oct2022 Corp (SGD) for their comparatively higher yields (Figure 4).
OLAMSP 5.5% SGD perpetual has a first call date of 11 Jul 22 with an indicative ask yield to call (“YTC”) of 9.6% on 29 Apr 20. If not redeemed, the distribution rate would reset to the sum of the prevailing SGD five-year swap rate, the initial spread of 368.5 basis points, and a step-up margin of 200 basis points. Although the reset benchmark is at a low level now, we hold the opinion that the extension risk is low given the step-up component and the issuer has good access to multiple funding channels.
We also recommend the OLAMSP 6% ‘22s for their appealing high yield of ~6.0%. Both the 6% ‘22s and 4.5% ‘21s are ranked senior unsecured, which are above the junior subordinated ranking of the perpetual notes. The Olam notes follow the terms and conditions of the company’s Euro medium term note program dated 15 Aug 15. The 4.5% 2021 bond had a yield to maturity of 14.6% as of 29 April.
USD investors may consider the OLAMSP 5.35% perp and OLAMSP 4.5% ‘21s following the significant decline in their prices. Recent quotes for the 5.35% perp indicated an ask YTC of 13.5%. If not redeemed on 20 Jul 21, the OLAMSP 5.35% perpetual note is resettable to the sum of the prevailing 5-year US Treasury yields, the initial spread of 4.29% and step-up margin of 2%.
Olam’s USD bonds are trading significantly wider than those of LDC. Last year, LDC delivered a better credit performance than Olam. But we would still prefer Olam’s bonds given their relative valuation and as LDC is still a private family-owned business with limited disclosures.
ADM and Bunge have stronger credit profiles and this is reflected in their respective yield curves. (On a side note: the lower yields may also be a consequence of the pledge by the US Fed to buy US corporate bonds including fallen angels.) ADM is rated A2/A/A, while Bunge has credit ratings of Baa3/BBB/BBB-. All three rating agencies have stable outlooks on the two companies’ credit ratings. Regardless, we are more inclined towards Olam’s bonds as they provide a higher risk-reward in our view.
Figure 4: Relative valuation
Declaration:
For specific disclosure, at the time of publication of this report, IFPL (via its connected and associated entities) holds a principal interest in the OLAMSP 6.000% 25Oct2022 Corp (SGD). The analyst who produces this report owns none of the abovementioned securities.