Highlight
- Leading Regulated Distributor with Government Backing: Ausgrid serves over 4 million customers through a 22,275 km² network and is 49.6% owned by the New South Wales Government, enhancing creditworthiness.
- Stable and Predictable Revenue: As of FY2025, 92% of revenue is regulated under AER frameworks, with 86% recoverable through mechanisms for customer defaults.
- Robust Financial Performance: Operating margins averaged ~36% over the past five years, with EBITDA interest coverage at 3.0 times in FY2025.
- Manageable Leverage and Debt Profile: Total debt of AUD 13.4 billion is supported by AUD 18 billion in PPE and AUD 1.3 billion in cash and credit facilities, with ample refinancing capacity.
- Recommendation: We prefer AUSGF 5.277% 10 Dec 2030 Corp (AUD) with an approximate 5-year tenure and a yield of 5.3%. and AUSGF 5.946% 10 Dec 2035 Corp (AUD) with an approximate 10-year tenure and a yield of 5.9%. Both bonds are BBB-rated by S&P and secured by all present and future property of the issuer.
Background
Ausgrid is an Australian electricity infrastructure company operating in the regulated electricity distribution sector. It owns, maintains, and operates an extensive network spanning 22,275 km² (approximately one-quarter the size of South Korea) along Australia’s east coast, serving Sydney, the Central Coast, and the Hunter Valley (New South Wales Area), and providing electricity to over 4 million people.
Ausgrid benefits from strong government backing, with the New South Wales Government holding a 49.6% stake. The remaining ownership is held by IFM Investors (25.2%), APG Asset Management Group (16.8%), and AustralianSuper (8.4%).
The path of electricity power
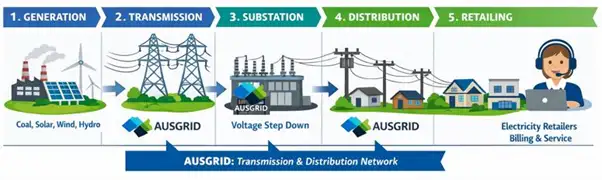
Ausgrid operates mainly in stages 2–4 of the electricity business (the transmission and distribution network). They earn revenue by transporting and distributing electricity through their networks. The transmission and distribution fees are paid by electricity retailers set by Australian Energy Regulator (AER) and included in the end consumer’s electricity bill.
Stable and Predictable Revenue of Electricity Distribution
As show in Table 1, Standard Control Services (SCS) form the core of operations, accounting for approximately 86% of total revenue, while Alternative Control Services (ACS) contribute around 6%. The remaining 8% comes from unregulated services, which are fully market-driven and exposed to competitive pressures. In addition, SCS is subject to recoverable through mechanisms for customer defaults, providing robust earnings visibility.
Although revenues are largely fixed within each five-year regulatory period, Ausgrid may apply for cost pass-throughs for certain unforeseen and uncontrollable events. For example, the AER approved partially Ausgrid’s recovery of incremental storm-related costs from the 2019–20 storm season. This demonstrates that pass-through mechanisms can partially mitigate revenue risk from extraordinary events, although recovery remains subject to strict regulatory criteria and approval, limiting margin flexibility.
Overall, approximately 92% of Ausgrid’s total revenue is regulated and subject to periodic pricing resets by the AER, resulting in stable, predictable cash flows that support the company’s financial stability.
As show in Table 2 below, Ausgrid’s operating margins have remained resilient of averaging approximately 36% over the past five years. Operating profitability is largely underpinned by predominantly regulated revenue recovery mechanisms as highlight above, which provide robust earnings visibility.
Table 1: Ausgrid Major Revenue Breakdown by Service Type and Regulatory Framework
|
Revenue Type |
% of Revenue |
Regulation Type |
Determination of Revenue |
Example |
|
Standard Control Services (SCS) |
86% |
Revenue cap (AER-regulated) – set for a five-year regulatory period |
Revenue is determined using a building-block approach based on the regulated asset base (RAB), which includes returns on and of capital, operating costs, taxes, and regulatory adjustments with any under-or over-recoveries reconciled, making earnings stable and predictable. |
Core electricity distribution services delivered to all customers |
|
Alternative Control Services (ACS) |
6% |
Price cap (AER-regulated)- set for a five-year regulatory period |
Usage-based revenue capped to recover efficient costs while limiting volatility. |
Services requested by specific or limited customers (e.g., metering, street lighting, network connections) |
|
Unregulated Services |
8% |
Market-based pricing |
Competitive services exposed to market demand and pricing. |
Contestable metering, EV charging, battery storage, property leasing |
|
Source: Ausgrid Group, iFAST compilations. Data as of 30 June 2025. |
||||
Predictable Revenue Supported by Monopoly Position and Long-Term Lease
Ausgrid’s core operational assets, including the electricity distribution network, are held under the 99-year Main Lease (Distribution Network Lease) with the Lessor, Alpha Distribution Ministerial Holding Corporation, a statutory state-owned entity. The lease transaction commenced in December 2016. This lease structure ensures long-term access to the essential network infrastructure required for the Group’s operations.
In addition, Ausgrid operates as a regulated natural monopoly in electricity distribution within its licensed service area in New South Wales, Australia. This monopoly is expected to persist over the long term because Ausgrid is the sole provider, and the combination of high capital and operating costs, together with regulatory exclusivity, reinforces its market position.
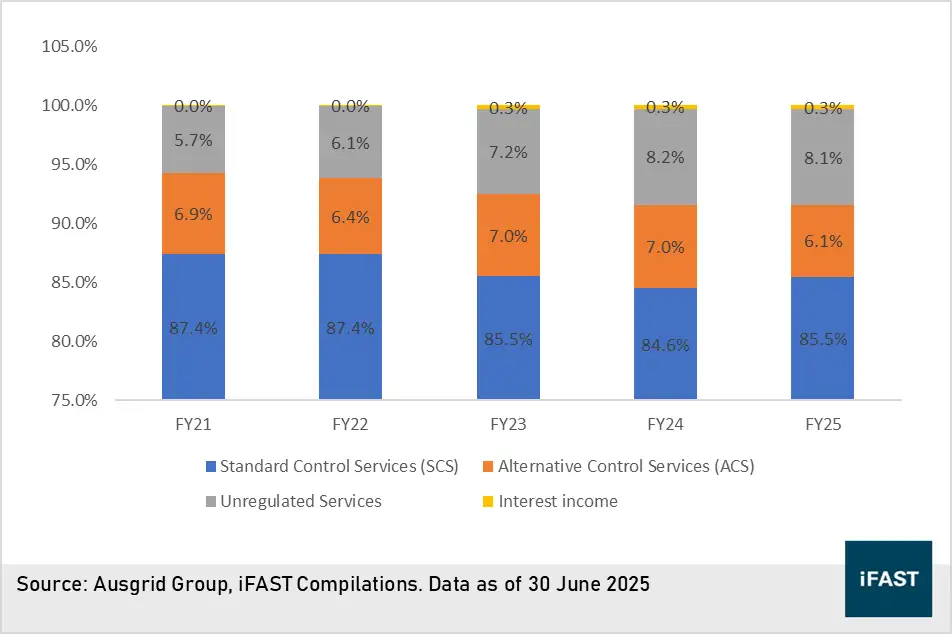
Transmission and distribution revenues are determined by the AER and are typically set for a five-year regulatory period, providing a clear revenue path. As shown in Chart 1, Standard Control Services (SCS) have accounted for an average of 86% of total revenue over the past five years, while Alternative Control Services (ACS) contributed around 7%. Notably, this revenue composition has remained broadly unchanged over the period, highlighting the stability and predictability of Ausgrid’s earnings under the AER’s regulated framework.
Chart 1: Ausgrid Revenue by Service Type, FY21–FY25
Rising Finance Costs Offset by Stable Interest Coverage
Finance costs increased by 26% to AUD $613 million, reflecting the lagged impact of the earlier high-interest-rate environment and 10% increase in total borrowings. Ausgrid’s weighted average interest rate rose from 3.9% in FY2024 (as of June 2024) to 4.7% in FY2025 (as of June 2025), resulting in higher interest expenses. Despite elevated interest expenses, LTM EBITDA interest coverage remains stable at 3.0 times, highlighting an adequate buffer to service debt obligations.
Table 2 Ausgrid’s Profit Indicators
|
FY21 |
FY22 |
FY23 |
FY24 |
FY25 |
|
|
Revenue (AUD Million) |
2,330 |
2,397 |
2,381 |
2,527 |
2,928 |
|
Operating Profit (AUD Million) |
680 |
1,123 |
740 |
799 |
1,159 |
|
Operating Profit Margin (%) |
29% |
47% |
31% |
32% |
40% |
|
Finance Costs (AUD Million) |
446 |
443 |
444 |
486 |
613 |
|
Weighted Average Interest Rate (%) |
3.50% |
3.45% |
3.54% |
3.91% |
4.71% |
|
LTM EBITDA interest coverage (Times) |
3.0 |
4.0 |
3.1 |
3.0 |
3.0 |
|
Source: Ausgrid Group, iFAST compilations. Data as of 30 June 2025. |
|||||
Debt levels rose but remains manageable
As of FY2025, Ausgrid’s total debt increased 10% to AUD 13.4 billion, primarily due to AUD 669 million of debt refinancing. Despite this increase, the company’s leverage remains moderate-to-high but manageable, with a debt-to-asset ratio of 56%, net debt-to-PPE of 71%, and a gearing ratio of 147%.
Compared with peers in Table 4, Ausgrid’s leverage is moderate. Its debt-to-asset ratio sits between TasNetworks (52%) and AusNet (68%), while net debt-to-PPE reflects strong asset backing. The gearing ratio indicates a reasonable equity buffer, substantially lower than AusNet’s 281% and broadly in line with TasNetworks. These metrics suggest a balanced capital structure relative to other regulated electricity networks.
Table 3 Ausgrid’s Credit Metrics
|
FY21 |
FY22 |
FY23 |
FY24 |
FY25 |
|
|
Total Debt (AUD Million) |
12,601 |
11,778 |
11,613 |
12,221 |
13,444 |
|
Property, Plant and Equipment (AUD Million) |
16,931 |
17,013 |
17,426 |
17,943 |
18,308 |
|
Net Debt to Property plant and equipment (Times) |
73% |
67% |
65% |
67% |
71% |
|
Gearing Ratio (Times) |
161% |
124% |
120% |
129% |
147% |
|
Debt to Asset Ratio (Times) |
58% |
52% |
51% |
53% |
56% |
|
Source: Ausgrid Group, iFAST compilations. Data as of 30 June 2025. |
|||||
Table 4 Peer Comparison
|
|
Ausgrid |
Ausnet |
TasNetworks |
|
Debt to Asset Ratio (Times) |
56% |
68% |
52% |
|
Net Debt to Property, Plant and Equipment (Times) |
71% |
84% |
55% |
|
Gearing Ratio (Times) |
147% |
281% |
153% |
|
Source: Company Report, iFAST Compilations. Data as of 31 December 2024, and 30 June 2025 |
|||
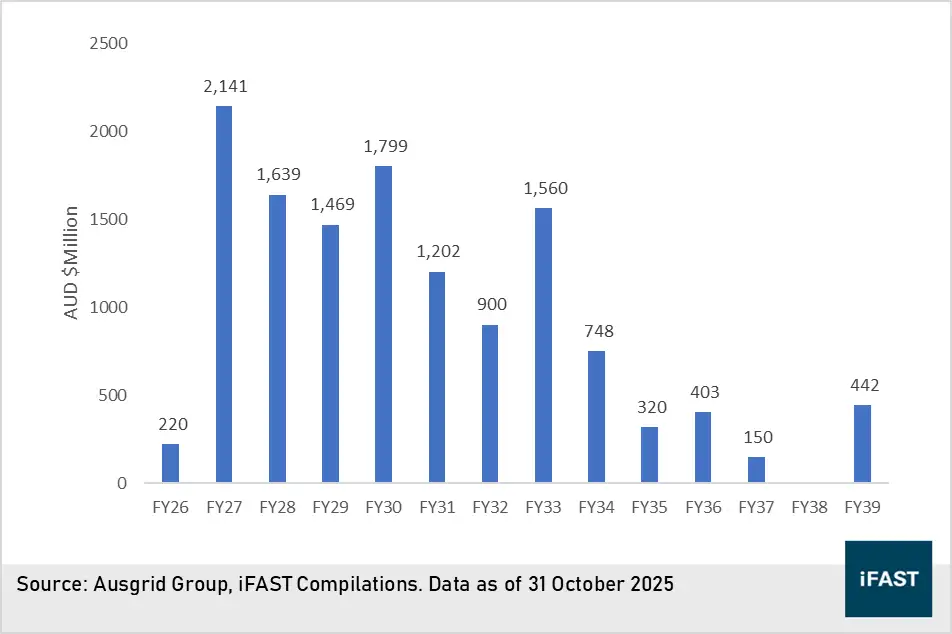
Ausgrid’s debt maturity profile, illustrated in Chart 1, is relatively front-loaded, with higher maturities concentrated between FY2027 and FY2033, averaging approximately AUD 1.5 billion per year. Near-term refinancing pressure is most pronounced in FY2026, with AUD 2.1 billion maturing, followed by AUD 1.6 billion in FY2027. While committed credit facilities of AUD 848 million and cash balances of AUD 442 million as at FY2025 are insufficient to fully cover upcoming maturities, the company is expected to refinance them in the near term. This may lead to a modest increase in the gearing ratio. However, Ausgrid’s current gearing remains among the lowest compared with peers in Table 4, and even with a potential near-term rise, it is expected to stay within a manageable range.
Refinancing risks are expected to be mitigated by Ausgrid’s substantial property, plant, and equipment base of approximately AUD 18.3 billion, combined with its regulated revenue framework, which provides stable and predictable cash flows under the AER-approved revenue recovery mechanism. Together, these factors support manageable leverage and adequate debt-servicing capacity.
Chart 2: Ausgrid's Debt Maturity Profile
Key Risks
- Regulatory reset risk: Revenue are subject to periodic AER determinations; any unfavourable changes could pressure cash flows. However, Ausgrid backed by government ownership partially mitigate these risks.
- Refinancing risk: Debt maturities between 2027–2033 may face higher costs if funding conditions tighten, although regulated cash flows mitigate risk.
- Disclosure & transparency risk: Being privately owned, Ausgrid provides less public disclosure, potentially limiting investor access to timely financial information.
Recommendation
Overall, Ausgrid is a regulated electricity distributor operating as a natural monopoly under a 99-year network lease, providing stable and predictable revenue through long-term AER frameworks. Its strength lies in the stable, regulated cash flows support robust financial performance and manageable leverage. We view its bonds as a worthy consideration for investors.
Investors should note that the bonds carry an early redemption feature, allowing the issuer to redeem before the call date at the higher of the outstanding principal or a calculated make-whole amount based on market swap rates plus a margin (interest rate). With most maturities between 2027 and 2033 as show in chart 2 above, early redemption risk is expected to be minimal.
For investors seeking medium-term exposure, we prefer the AUSGF 5.277% 10 Dec 2030 Corp (AUD), with an approximate 5-year tenor and a yield of 5.3%. For those with an appetite for longer-term exposure, the AUSGF 5.946% 10 Dec 2035 Corp (AUD), with an approximate 10-year tenor and a yield of 5.9% are decent in our opinion.
Ausgrid bonds are rated BBB by S&P and are secured, with all present and future property of the issuer (Ausgrid Finance Pty Ltd) serving as collateral; the bonds are primarily supported by multiple guarantors across the Ausgrid Group, including operational and asset partnerships as well as holding entities, ensuring security from the group’s assets and cash flows.
Table 4: Ausgrid’s Bond
|
Bond name |
Year to Call/Maturity |
Yield to Call/Maturity |
Min / Sub investment |
|
4Y 8M/4Y11M |
5.3%/5.3% |
AUD 10,000/10,000 |
|
|
9Y8M/9Y11M |
5.9%/5.9% |
AUD 10,000/10,000 |
|
|
Source: FSMONE, iFAST Compilations. Data as of 8 January 2026. |
|||
Declaration
For specific disclosure, at the time of publication of this report, IFPL (via its connected and associated entities) and the analyst who produced this report holds a NIL position in the abovementioned securities.