As Singapore’s COVID-19 cases remain low or at zero, citizens are starting to return to a resemblance of their normal life. Suburban malls have benefited and Frasers Property is one of the beneficiaries. Investors have a few perpetual bonds of the firm to choose from, and we will evaluate them in this article.
Operating results for FY20
Frasers Property Limited (the “Group”) recently announced its financial results for FY20 ending Sep 2020. The Group’s revenue and profits before interest and tax (“PBIT”) looked resilient, decreasing from S$3.79 billion to S$3.60 billion (-5.1%) and from S$1.29 billion to S$1.24 billion (-3.6%) respectively, as compared to FY19 results.
However, net profit fell by 51.4% from S$1,067 million to S$518.8 million, in large part due to fair value change on investment properties decreasing from S$544.4 million to S$161.9 million. The fair value change was negatively affected by lower valuations recorded by some of the Group’s hospitality properties and the absence of a one-off fair value gain from the dilution of interest in an office tower in the previous period.
There were multiple reasons that made the results better despite the situation arising from the COVID-19 outbreak. Naturally, the hospitality segment was adversely affected with PBIT declining by 85.1% as compared to FY19. Operating results for Singapore’s retail properties also declined, but the acquisition of AsiaRetail Fund Limited (“ARF”) helped compensate for the decline. Revenue and PBIT from Singapore’s residential properties also decreased as North Park Residences and Parc Life were fully sold in FY19.
The reorganisation of business segments shifted numbers around, following the Group’s announcement of the formation of Frasers Property Industrial (“FPI”), an integrated industrial and logistics platform as a strategic business unit, effective from 1 Oct 19. Subsequently, on 14 Apr 20, Frasers Commercial Trust merged with Frasers Logistics & Industrial Trust to form Frasers Logistic & Commercial Trust. The Industrial operating segment includes the ownership, management and operation of commercial properties and business parks in Australia, Singapore and the UK. The reshuffling of operating segments resulted in lower numbers for Singapore and higher numbers for Industrial.
For Australia’s business segment, revenue for the previous financial year was much higher due to completions of higher-value projects, including Discovery Point and Central Park. Fewer residential units were also sold in FY20, resulting in a huge decrease in PBIT. In Thailand, the consolidation of Golden Land Property Development Public Company Limited helped to bump up the numbers.
Despite profits of S$518 million, the Group’s cash balance declined by S$75 million due to a few reasons. $334 million of cash was spent on development expenditures for a new project in Singapore, and together with progressive development expenditures for projects in Thailand and Australia, led to a cash outflow of S$956 million relating to properties held for sale. Meanwhile, several acquisitions and investments were made, resulting in a cash outflow of S$1.68 billion in investing activities.
Table 1
PBIT of various business segments
|
S$ million |
FY20 |
FY19 |
Change |
|
Singapore |
312.7 |
456.6 |
-32.8% |
|
Australia |
38.3 |
79.2 |
-51.6% |
|
Thailand & Vietnam |
265.4 |
130.1 |
104.0% |
|
Others |
319.5 |
291.1 |
9.8% |
|
Industrial |
351.1 |
246.9 |
42.2% |
|
Hospitality |
19.6 |
131.8 |
-85.1% |
|
Corporate and others |
-61 |
-52.1 |
17.1% |
|
Total |
1,245.6 |
1,292.6 |
-3.6% |
|
Source: Company |
|||
Credit profile
Looking at the Group’s debt, it has a sizable amount maturing in the next three years, including about S$1 billion worth of bonds.
Figure 1
Frasers’ debt maturity profile
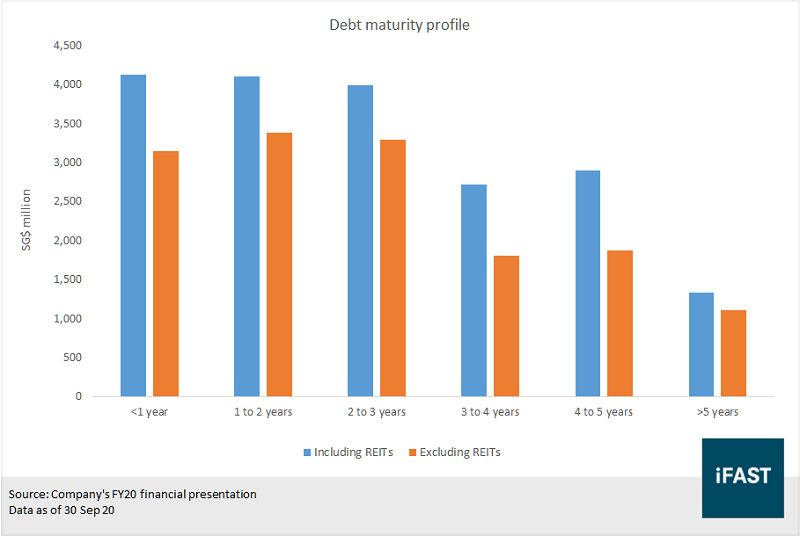
Table 2
Balance sheet
|
S$'000 |
As at 30 Sep 20 |
|
Non-current assets |
|
|
Investment properties |
21,947,848 |
|
PPE |
2,423,793 |
|
Investments in |
|
|
- Subsidaries |
- |
|
- Joint ventures |
1,063,859 |
|
- Associates |
1,219,432 |
|
Other non-current assets |
66,781 |
|
Intangible assets |
633,579 |
|
Other receivables |
561,844 |
|
Deferred tax assets |
123,543 |
|
Derivative financial instruments |
175,475 |
|
Total non-current assets |
28,216,154 |
|
Current assets |
|
|
Properties held for sale |
5,886,203 |
|
Contract assets |
153,549 |
|
Other current assets |
74,233 |
|
Trade and other receivables |
548,638 |
|
Derivative financial instruments |
3,252 |
|
Bank deposits |
236,886 |
|
Cash and cash equivalents |
3,085,110 |
|
Assets held for sale |
544,095 |
|
Total current assets |
10,531,966 |
|
|
|
|
Total assets |
38,748,120 |
|
Current liabilities |
|
|
Trade and other payables |
1,300,026 |
|
Contract liabilities |
75,760 |
|
Derivative financial instruments |
26,453 |
|
Provision for taxation |
512,327 |
|
Lease liabilities |
20,803 |
|
Loans and borrowings |
4,126,393 |
|
Liabilities held for sale |
- |
|
Total current liabilities |
6,061,762 |
|
Non-current liabilities |
|
|
Other payables |
624,998 |
|
Derivative financial instruments |
344,262 |
|
Deferred tax liabilities |
716,759 |
|
Lease liabilities |
823,814 |
|
Loans and borrowings |
15,061,241 |
|
Total non-current liabilities |
17,571,074 |
|
Total liabilities |
23,632,837 |
|
Source: Company's FY20 financial results, iFAST compilations |
|
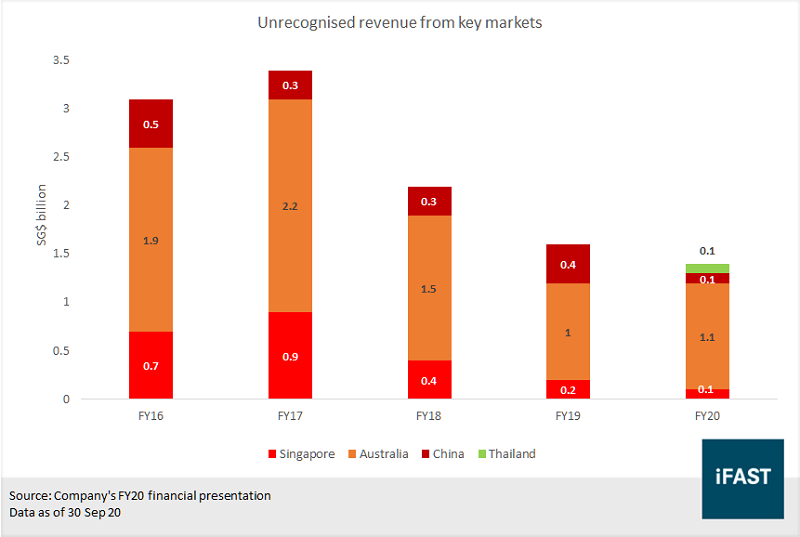
In the next year, the Group has S$4.13 billion worth of debt expiring, for which their cash holdings of S$3.09 billion are insufficient to repay. However, there is S$1.4 billion of unrecognized revenue as at end-September and about S$5.3 billion of properties and assets held for sale after adjusting for that.
Figure 2
Unrecognised revenue from key markets
The Group has also been able to refinance its debt through bank loans. In FY19, the Group borrowed S$790 million and in FY20, it managed to borrow S$2.8 billion from banks, while redeeming S$700 million of 5% perpetual notes in March 2020. The Group’s AUD 750 million dual-tranche term loan was crowned Best Green Loan for Real Estate at The Asset’s Triple A Sustainable Capital Markets Regional Awards 2019. Thus, we think refinancing should not be a problem for Frasers Property, and it is unlikely that the Group will encounter troubles redeeming its bonds.
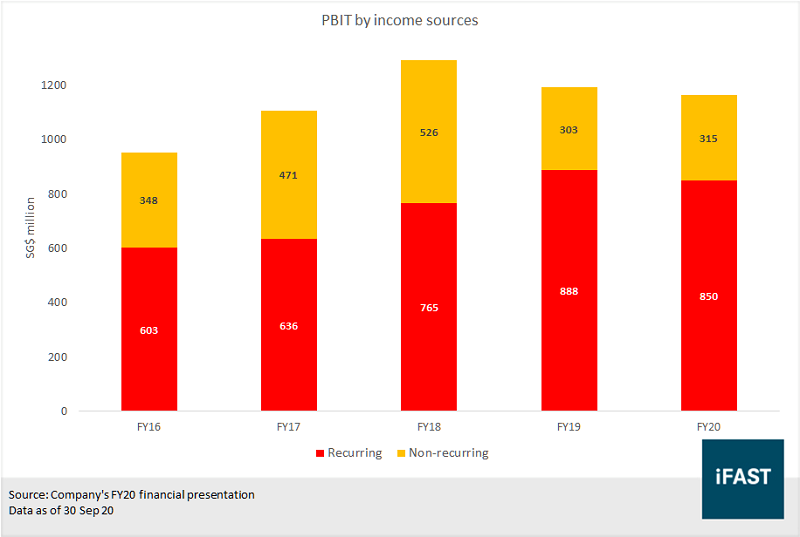
Furthermore, the Group’s recurring income has grown over the years and is a large part of its total PBIT, as seen in Figure 3. Due to the COVID-19 situation, recurring PBIT fell in FY20, but it should rebound in the subsequent quarters due to a few reasons. Firstly, suburban malls have seen higher sales volumes since Phase 2 begun. Furthermore, the Group has disbursed approximately S$105 million worth of tenant support package until Sep 2020. With Phase 3 supposedly looming on the horizon, the Group may be weaning tenants off the support package, which would translate to higher revenue. Hospitality income should also improve slightly as more travel bubbles are implemented.
Figure 3
Recurring PBIT has been increasing
Which Frasers bond to invest in?
If we look at the Group’s yield curve, the perps look the most attractive yield-wise. However, deciding which perp is best to invest in is a more complicated matter.
Figure 4
Frasers Property yield curve
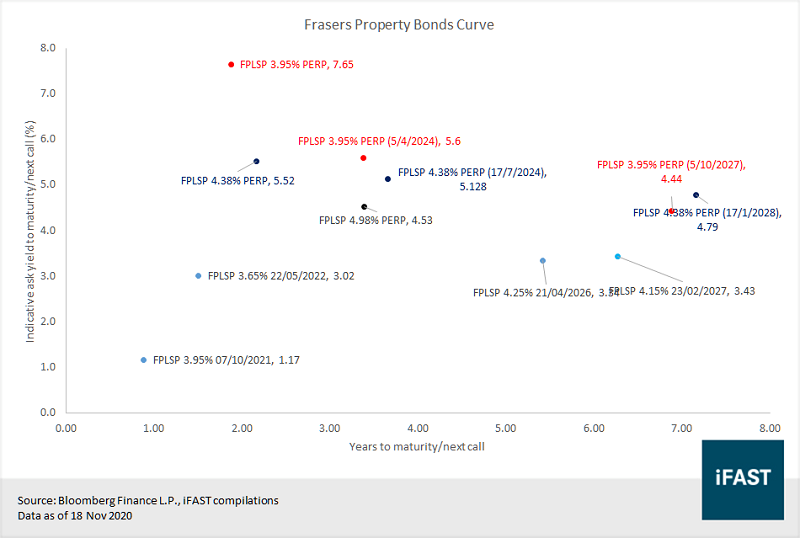
Out of the three FPLSP perps, the FPLSP 3.950% Perpetual Corp (SGD) has the earliest call date of 05 Oct 22, followed by the FPLSP 4.980% Perpetual Corp (SGD) (11 Apr 24), and lastly theFPLSP 4.380% Perpetual Corp (SGD) perp (17 Jan 28). The 3.95% perp will reset in October 2022 at the prevailing five-year SGD SOR plus 2.245%. For the 3.95% perp to maintain its coupon rate, the 5Y SGD SOR must be at least 1.705%, which was last seen in Jun 19. Since then, twelve-month SIBOR rates and the 5Y SGD SOR have declined to 0.81% and 0.50% respectively, as of 23 Nov 20.
If global interest rates were to remain low until late 2022, it is likely that the 3.95% perp will reset at a lower coupon rate. Investors seem to be pricing in this possibility and the likelihood of a non-call given the price of the 3.95% perp. However, the bond price could still decline further if its reset rate turns out lower than what is currently expected.
On the other hand, if the inverse were to happen – that is if interest rates rise before October 2022 – the 3.95% perp’s price is likely to increase as its coupon rate would reset to a higher rate, thus increasing its likelihood of being called.
Investors thus have an interesting choice to make. For those who is looking for higher stability and good yields, the 4.98% perp seems to be the best choice. It offers a good yield to call of 4.53% and is likely to be called on the next call date in our view, given that it poses the highest interest expense to the Group.
With a higher initial spread, the 4.38% perp’s yield changes across time are “gentler” than the 3.95% perp. At this juncture, the 4.38% perp is a safer investment as compared to the 3.95% perp. As the SOR is tied to the USD/SGD rate, which in turn is highly correlated to the Federal Funds rate, investors who want to chase capital gains can opt for the 3.95% perp since the USD/SGD is relatively low today and unlikely to reach 2011-2015 levels in our view. A more successful implementation of vaccine distribution and quicker economic rebound could send the USD/SGD rate and benchmark rates higher, which will be good for the 3.95% perp’s price.
Relative valuation
If we look at its peers, Frasers Property actually has one of the highest leverage ratios, with only GuocoLand having comparable numbers to them. However, Frasers Property is also one of the biggest names in Singapore, with only CapitaLand in this list having more assets than them. Frasers Property’s leverage ratios are also higher following the redemption of perps in March, which we think were refinanced with bank loans.
If Frasers Property manages to keep its debt levels from burgeoning, the Group’s bonds would still be a safe investment as long as its interest coverage ratio remains stable or improve, since the major concern would be on refinancing. On this front, the Group should face little difficulties due to its high recurring income, new acquisitions and the prospects of a recovery.
Table 3
Credit ratios
|
EBIT over interest (x) |
Net gearing (%) |
Debt over total assets (%) |
|
|
AIMS APAC REIT |
2.8 |
66.5 |
39.1 |
|
ARA LOGOS Logistics Trust |
3.8 |
78.7 |
43.5 |
|
Ascott Residence Trust |
2.4 |
61.9 |
38.6 |
|
CapitaLand Ltd |
0.9 |
64.6 |
39.1 |
|
ESR-REIT |
2.8 |
87.1 |
44.2 |
|
Frasers Property Ltd |
2.56 |
95.7* |
51.9 |
|
GuocoLand Ltd |
2.3 |
96.6 |
47.5 |
|
SPH |
3.9 |
49.1 |
35.8 |
|
SPH REIT |
5.4 |
41.1 |
29.5 |
|
Wing Tai Holdings Ltd |
1.1 |
12.9 |
15.4 |
|
Source: Bloomberg Finance L.P., iFAST compilations Data as of 30 Jun 20, except Frasers Property (based on 30 Sep 20 numbers) *Pro forma net debt-to-equity ratio post-divestment of ARF to FCT and equity fund raising by FCT |
|||
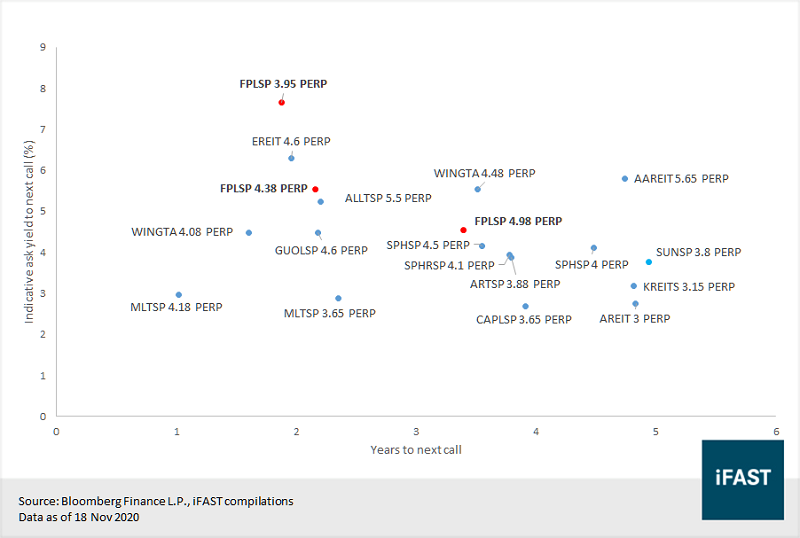
Looking at the lot, Frasers Property’s perps look attractive, second to the EREIT perps. In this space and following the logic explained earlier, the FPLSP 4.380% Perpetual Corp (SGD) looks the most attractive, offering a balance of high payouts and a chance for capital gains if it were to be called earlier than currently expected. The FPLSP 3.950% Perpetual Corp (SGD) offers high yield to next call but has the highest risk of not being called. Investors who want a more stable bond price can opt for the FPLSP 4.980% Perpetual Corp (SGD) .
Figure 5
Frasers’ perps look attractive
Declaration: For specific disclosure, at the time of publication of this report, IFPL (via its connected and associated entities) hold positions in ARASP 5.200% Perpetual Corp (SGD), FPLSP 4.980% Perpetual Corp (SGD) and SPHSP 4.500% Perpetual Corp (SGD). The analyst who produced this report hold a NIL position in the abovementioned securities.
Our podcast series, Yield Hunters, is available on Spotify, iTunes Podcasts and Google Podcasts. We share our thoughts on new bond issues and hold discussions on the fixed income space. Listen to our latest episode below and follow us!