
The US midterm elections concluded on 3 November, and data centres have suddenly become a focus for the market. The day after the results were announced, the five-year CDS of neocloud CoreWeave surged, while those of the hyperscalers held relatively steady (see Chart 1). This article examines why voters are pushing back against data centres, where Democratic policy is heading, and the impact on the issuers involved.
Chart 1: Five-year CDS of data centre-related issuers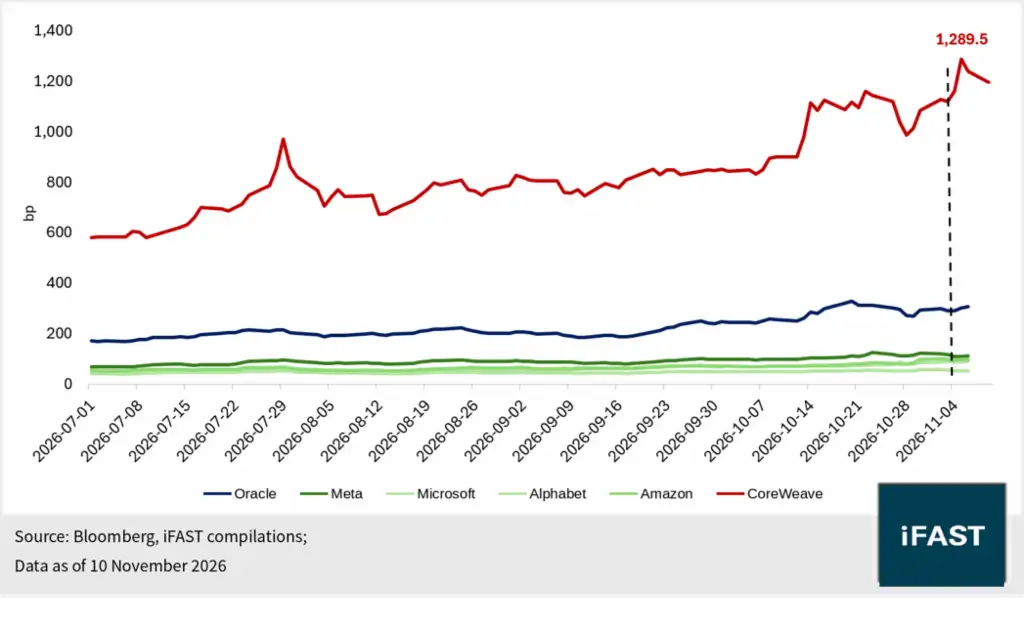
Unpopular with Voters, Data Centres Became Key to the Democratic Landslide
A CNBC voter survey found that 56% of voters said data centres were a key factor in how they voted. Of the 41 local ballot measures with results announced, 30 saw the side favouring restrictions on data centres win 70% or more of the vote. As early as September, polls showed that majorities of both Democratic (70%) and Republican (57%) voters supported limits on new data centres, indicating that the backlash had already crossed party lines. Voters’ grievances centre on four areas:
Electricity bills: Data centres consume huge amounts of electricity, forcing grids to run higher-cost generating units and build new transmission infrastructure. These costs are generally added to electricity bills and shared by all customers in the region. The Dallas Fed estimates that data centres have raised US wholesale electricity prices by about 6.9%.
Water: Conventional evaporative cooling consumes large volumes of water, which in water-scarce areas means competing with residents and farmers for limited supplies.
Pollution: To come online as quickly as possible, some data centres generate their own power directly with gas turbines. Elon Musk’s Colossus 1 in Memphis, for example, was at one point powered by as many as 35 unpermitted gas turbines.
Siting and noise: Many data centres sit right next to homes, and cooling equipment running around the clock emits low-frequency noise; residents worry that property values will fall as a result.
Democrats seized on this sentiment during the campaign, tying data centres to rising electricity bills and tax breaks for big business, and targeting Republican opponents who had championed data centre development. An NBC poll showed Democrats leading by 12 percentage points on which party voters trust most to handle the data centre issue. In Texas, Hinojosa attacked Governor Abbott for allowing data centres to proliferate, and went on to defeat Abbott in his bid for a fourth term, becoming the first Democrat elected governor of Texas since 1990. In the end, Democrats not only won control of both chambers of Congress but also took the governorships of Texas, Ohio, Georgia and Nevada from the Republicans.
Policy Risk: Delay, Not Cancellation
Democratic data centre policy is broadly heading in three directions: pausing approvals, scrapping tax incentives, and requiring data centres to bear the full cost of grid and utility infrastructure (see chart 2). New York led the way with a moratorium in July, and the incoming governors of Texas, Ohio and other states have pledged to follow. Cleanview estimates that the states likely to tighten regulation account for about 41% of planned US data centre capacity, with Texas alone accounting for about 23% of the national total.
Chart 2: Party control of key data centre states
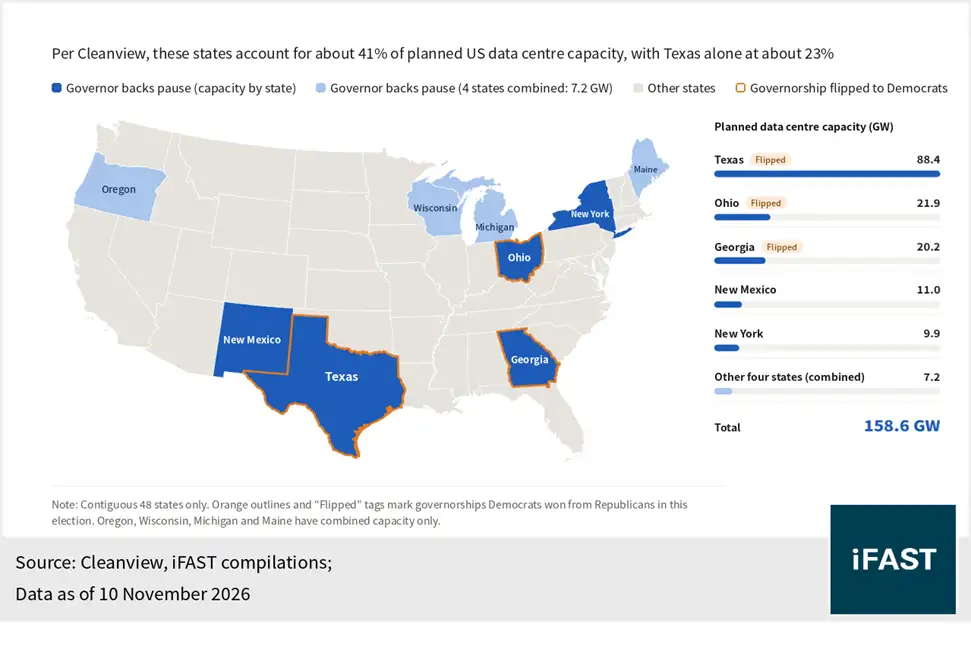 However, these policies are more likely to delay data
centres than to cancel them. Ohio’s conditional pause simply requires data
centres to bear their full costs, so projects that meet the conditions can go
ahead and the impact is mainly higher costs. In Texas, incoming governor
Hinojosa has pledged to keep the pause in place until the state legislature
passes new laws, which gives the pause a clear condition for being lifted. On
timing, SemiAnalysis estimates that about three-quarters of 2027 capacity in
the top 20 states is already under construction, so the impact is limited; more
2028 projects are still at the planning stage and more exposed to delays, with
Texas accounting for nearly 30% of the capacity due online in 2028.
Robust demand for AI computing power also makes construction hard to halt. Goldman Sachs forecasts that US data centre power demand will rise from 31 GW in 2025 to 66 GW in 2027. Developers will look for alternatives, such as expanding existing campuses already accepted by local communities, or moving to more lightly regulated states or even overseas. As for a nationwide moratorium, Democrats lack the two-thirds majority needed to override a presidential veto, so it is unlikely to happen. In other words, the risk is mainly about timing: uncertainty over approvals, grid connections and tax incentives will push back the completion dates from which revenue is generated, and delay risk affects different issuers in very different ways.
Neoclouds: Hit Hardest
On the day after the election (4 November), CoreWeave’s 2031 bonds fell as low as 79.5, among the worst-performing high-yield bonds that day; the yield to maturity on its 9.625% 2032 bonds rose above 16%, and its five-year CDS briefly exceeded 1,289 bp on 5 November, surpassing its October high.
CoreWeave’s debt-servicing capacity rests not on current earnings, but on whether its backlog converts into cash on schedule and whether markets remain willing to keep funding it. Although third-quarter revenue rose 168% year on year and its *adjusted operating margin rose to 10%, adjusted operating income of US$379 million was still not enough to cover US$846 million of interest. Delays therefore hit it hardest, mainly in three ways:
*Adjusted operating income is a non-GAAP measure reported by CoreWeave, calculated as operating income plus stock-based compensation, acquisition-related costs and amortisation of acquired intangible assets; depreciation is not added back.
Revenue delayed, interest still due: Interest starts accruing as soon as loans are drawn, but revenue cannot be recognised while a data centre’s start-up is delayed. Measured by operating cash flow, interest coverage has fallen from about 3.1x in the first half to about 2.3x in the third quarter, a steadily shrinking buffer.
Rising funding costs: Management has said it will not issue unsecured debt yielding over 15% before 2027 and will rely more on delayed draw term loans (DDTLs) secured by customer contracts. However, the DDTL 5.5 completed in August already carries a spread of SOFR + 550 bp, 125 bp above July’s initial price talk, and policy risk could push spreads higher again.
Rising compliance costs: Even if projects are eventually approved, developers may have to pay for grid upgrades themselves. As take-or-pay contracts are mostly fixed-price, the extra costs may not be passed on to customers – adding to the strain on a still-unprofitable CoreWeave.
That said, the impact may not show up immediately. Management says all capacity due for delivery in 2027 already has permits and is under construction, and its key Texas project, Helios, is expected to start deliveries in the first half of 2027. On liquidity, the company has about US$6.5 billion of cash (including restricted cash), nearly US$5 billion of undrawn DDTL capacity and about US$9 billion of customer prepayments expected over the next three months, enough to meet about US$10.6 billion of debt due within a year; but once fourth-quarter capex of about US$6–8 billion is taken into account, the buffer is relatively thin.
The real test comes from 2028 onwards, when new capacity will face stricter approvals head-on. Although contracted power outside the US has grown to over 1.3 GW, most of it will not come online until 2028, so it can only partly diversify US policy risk. Investors can treat 2027 as an observation period, keeping an eye on delivery progress, interest coverage and financing terms.
Related article : CoreWeave Bond Yields Top 15%! Sector Headwinds Trigger a Sell-Off – Should Sell or Hold?
Hyperscale’s: Less Affected, Possibly Even Beneficiaries
Hyperscalers have been hit relatively mildly. Although Amazon’s CDS has risen 44% over the past month, this mainly reflects heavy bond supply, and its absolute level remains low. The election result is a double-edged sword for their earnings, but not necessarily bad news for their bonds.
As sellers of computing power, hyperscalers may see their pricing power strengthen further. Compute was already in short supply: cloud rental prices for Nvidia Blackwell GPUs rose by about 48% between February and April this year alone. If tighter approvals slow the growth of new capacity, the supply-demand imbalance will persist and data centres already in operation will become more valuable.
But they are also the biggest buyers of compute. Capacity leased from neoclouds is mostly under multi-year take-or-pay contracts at locked-in prices, so near-term costs are unaffected. Pressure will come mainly from newly signed and renewed compute (CoreWeave, for example, has raised its product prices by about 25% this year) and from compliance costs at their self-built data centres, so the hit to earnings will be gradual.
For bonds, the key is supply. Goldman Sachs estimates that hyperscaler bond issuance has reached US$296 billion this year and forecasts it will rise to US$440 billion in 2027. Tighter policy could slow this trend: Wells Fargo estimates that every 10% reduction in planned Texas capacity cuts big tech’s AI infrastructure spending by 1.6%. Slower spending means less bond supply, which would help spreads tighten. On credit quality, Microsoft, Alphabet, Meta and Amazon carry bond credit ratings of AA- to AAA, with net gearing close to zero or even negative. Even though some of them saw free cash flow turn negative in the third quarter, they still have ample borrowing headroom and limited debt-servicing pressure (see Table 1).
Table 1: Financial profile of data centre-related issuers
|
Issuer |
Bond credit rating |
Net gearing |
Free cash flow, latest
quarter |
|
Microsoft |
AAA |
Net cash ~US$29bn |
+18.6 |
|
Alphabet |
AA+ |
Net cash ~US$39.6bn |
-9.1 |
|
Meta |
AA- |
Net cash ~US$1.5bn |
-2.1 |
|
Amazon |
AA- |
~10% |
-34.8 |
|
Oracle |
BBB- |
~132% |
-5.4 |
|
CoreWeave |
B |
~1,060% |
-7.5 |
|
Source: Company reports, iFAST
compilations; |
|||
Oracle: Caught in Between, With Rating Risk Outweighing Default Risk
Although Oracle is generally classed as a hyperscaler, its credit profile is closer to that of a neocloud: management expects free cash flow to turn positive only in the second half of fiscal 2028, its expansion relies on external financing, and about half of its backlog is tied to OpenAI, which is not yet profitable. S&P downgraded Oracle to BBB- in July, just one notch above non-investment grade.
On policy, Oracle’s Stargate projects are spread across Texas, Michigan, New Mexico and Wisconsin, whose incoming governors all support some form of pause. Unlike typical neoclouds, Oracle tends to build its own off-grid power supply, which does not use the public grid or push up household electricity bills – in line with the Democrats’ call for data centres to supply their own power. However, self-built power is mostly gas-fired and still requires environmental approval; in New Mexico, Project Jupiter was held up after its gas pipeline application was rejected. If delays occur, the equipment Oracle has bought with borrowed money cannot be put into service, while interest and depreciation keep accruing – a situation similar to CoreWeave’s.
That said, most of Oracle’s major projects are already under construction and are expected to be delivered progressively from the end of this year through 2027. Its financial cushion is also thicker than CoreWeave’s: interest coverage is about 6.5x, and its US$31.3 billion of cash is enough to cover about US$20.8 billion of debt maturing over the next three years, so near-term default risk is low. The real risk lies in its rating: if delays push back the point at which free cash flow turns positive, the likelihood of Oracle being downgraded to non-investment grade will rise, in which case some funds may be forced to sell and bond prices would come under further pressure.
Bond Investment Views
The cost of delays will be borne mainly by issuers with high debt levels that depend on external financing. We therefore favour hyperscaler bonds with high ratings and ample cash flow, which offer exposure to AI growth while being better able to absorb policy and compliance costs (see Table 2). More importantly, hyperscaler bond issuance has hit a record this year, leaving their spreads wider than those of similarly rated corporate bonds. Take Meta’s 2036 bond: its yield to maturity of about 6.3% is about 140 bp above 10-year US Treasuries, roughly twice the average spread on AA-rated corporate bonds. This extra yield stems mainly from supply pressure rather than any deterioration in credit quality, making now a good time for investors who want exposure to the AI theme without the volatility of neoclouds.
Table 2: Hyperscale bonds available on Bondsupermart Live
|
Issuer |
Bond |
Ccy |
Tenor (yrs) |
Price |
Yield to maturity |
|
Microsoft Corp |
MSFT 2.525% 01Jun2050 Corp (USD) |
USD |
23.57 |
55.32 |
6.14% |
|
Alphabet Inc |
GOOGL 4.875% 15Aug2031 Corp (USD) |
USD |
4.76 |
97.63 |
5.45% |
|
Alphabet Inc |
GOOGL 4.500% 15May2035 Corp (USD) |
USD |
8.51 |
92.32 |
5.65% |
|
Alphabet Inc |
GOOGL 6.250% 15Aug2046 Corp (USD) |
USD |
19.77 |
98.81 |
6.36% |
|
Alphabet Inc |
GOOGL 2.050% 15Aug2050 Corp (USD) |
USD |
23.77 |
48.56 |
6.23% |
|
Alphabet Inc |
GOOGL 5.200% 27Aug2029 Corp (AUD) |
AUD |
2.79 |
99.40 |
5.43% |
|
Alphabet Inc |
GOOGL 5.500% 27Aug2031 Corp (AUD) |
AUD |
4.79 |
99.00 |
5.74% |
|
Alphabet Inc |
GOOGL 6.250% 27Aug2036 Corp (AUD) |
AUD |
9.80 |
100.50 |
6.18% |
|
Alphabet Inc |
GOOGL 6.900% 27Aug2046 Corp (AUD) |
AUD |
19.80 |
98.70 |
7.02% |
|
Alphabet Inc |
GOOGL 5.500% 13Nov2041 Corp (GBP) |
GBP |
15.02 |
89.72 |
6.60% |
|
Meta Platforms Inc |
META 4.600% 15May2028 Corp (USD) |
USD |
1.51 |
99.49 |
4.95% |
|
Meta Platforms Inc |
META 4.550% 15May2031 Corp (USD) |
USD |
4.51 |
95.85 |
5.61% |
|
Meta Platforms Inc |
META 5.250% 15May2036 Corp (USD) |
USD |
9.51 |
92.80 |
6.27% |
|
Meta Platforms Inc |
META 5.500% 15Nov2045 Corp (USD) |
USD |
19.02 |
83.07 |
7.14% |
|
Meta Platforms Inc |
META 6.300% 15May2056 Corp (USD) |
USD |
29.53 |
88.16 |
7.28% |
|
Amazon.com Inc |
AMZN 2.700% 03Jun2060 Corp (USD) |
USD |
33.58 |
48.26 |
6.43% |
|
Amazon.com Inc |
AMZN 4.600% 09Jul2029 Corp (USD) |
USD |
2.66 |
98.24 |
5.13% |
|
Amazon.com Inc |
AMZN 5.450% 20Nov2055 Corp (USD) |
USD |
29.04 |
84.77 |
6.58% |
|
Amazon.com Inc |
AMZN 6.650% 14Sep2045 Corp (GBP) |
GBP |
18.85 |
100.57 |
6.49% |
|
Source: FSM Global, iFAST compilations; |
|||||
Oracle bonds yield more than similarly rated bonds and near-term default risk is low, but its rating is only one notch above non-investment grade, and a downgrade could put further pressure on bond prices. We think its bonds suit investors seeking higher yields who are willing to accept some price volatility, preferably focusing on short- to medium-term maturities.
CoreWeave sits in a higher risk tier. As of 11 November, the yield to maturity on its 2030 bond was about 14.9%, roughly twice that of Oracle bonds of similar tenor. However, its bond prices swing sharply with delivery progress, financing conditions and policy news, making them better suited to aggressive investors as tactical trades (see Table 3).
Table 3: Oracle and CoreWeave bonds available on Bondsupermart Live
|
Issuer |
Bond |
Ccy |
Tenor (yrs) |
Price |
Yield to maturity |
|
Oracle Corp |
ORCL 4.550% 04Feb2029 Corp (USD) |
USD |
2.23 |
94.881 |
7.07% |
|
Oracle Corp |
ORCL 4.950% 04Feb2031 Corp (USD) |
USD |
4.23 |
91.200 |
7.41% |
|
Oracle Corp |
ORCL 5.875% 26Sep2045 Corp (USD) |
USD |
18.89 |
75.013 |
8.57% |
|
CoreWeave Inc |
CRWV 9.250% 01Jun2030 Corp (USD) |
USD |
3.55 |
84.805 |
14.91% |
|
Source: FSM Global, iFAST compilations; |
|||||
For specific disclosure, at the time of publication of this report, IFPL (via its connected and associated entities) holds positions in the abovementioned securities, including bonds issued by Microsoft Corp, Alphabet Inc (multiple USD, AUD and GBP issues), Meta Platforms Inc, Amazon.com Inc, Oracle Corp and CoreWeave Inc (as listed in the tables above). The analyst who produced this report holds NIL positions in the abovementioned securities. This research report was prepared with the assistance of artificial intelligence (AI) tools. iFAST Financial Pte Ltd does not rely exclusively on AI for content generation; the content of this report – including all investment theses, ratings, price targets and conclusions – has been independently reviewed and verified by the research analyst(s) to ensure accuracy and professional integrity.
RISK DISCLOSURE STATEMENTS FOR BONDS
Key risks of investing in bond
|
Key risks of investing in high-yield bonds
|
| Bonds with special features Some bonds may contain special features and risks that warrant special attention. These include bonds:
|
Remarks
|