• Pipeline reinforcement: Seagen-driven oncology assets and a broadening late-stage pipeline are on track to replace patent cliff revenue losses approaching 2026-2028, meaningfully.
• Expense discipline: The USD$4.5b cost realignment program, now at full run-rate, is structurally defending margins against accelerating generic erosion.
• Diversified market leadership: Pfizer’s multi-therapeutic footprint across oncology, vaccines, and rare disease provides a durable cash flow safety net against single-product concentration risk.
• Liquidity & Credit Profile: Liquidity remains adequate with manageable near-term maturities, though Pfizer’s pace of deleveraging back toward ~2.5x net debt to EBITDA remains a key metric to monitor.
Financial Highlights
Overall, Pfizer delivered resilient financial results for the full year ending 31 December 2025 (FY2025). Revenue was stable at USD$62.6b (compared to FY2024: USD$63.6b), while adjusted EBITDA (a fairer representation of the group’s core operating strength) declined 7.3% year on year (YoY) to USD$16.8b (FY2024: USD$18.1b). More importantly, we highlight that Pfizer’s recently launched and acquired therapeutics are gaining traction, delivering double-digit growth; we view this as an encouraging signal that the group is beginning to build the new revenue bridge ahead of its 2027 – 2030 patent cliff (discussed further below). Operating cash flow (OCF) softened to USD$11.7b (compared to FY2024: USD$12.7 b) while free cash flow (FCF) followed suit at USD$9.1b (compared to FY2024: USD$9.8b).
At first glance, Pfizer’s softer cash flows may give pause. However, we think the headline numbers alone do not tell the full story. Pfizer today is a group in active transition –still absorbing the revenue hangover from its COVID-19 franchise peak (FY2021 to FY2022, which distorts most of the group’s figures and metrics), while simultaneously deploying capital to reshape a pipeline facing meaningful patent risk between 2027 and 2028 (see table 1 below). Note: When a drug patent expires, it’s common for the pharmaceutical company to lose approximately 80% to 90% of revenue within 12 months of generic entry. In our view, the more instructive signal lies in the momentum building within its newer therapeutics, which suggest the group is laying the groundwork for a more durable, diversified earnings base. We explore this dynamic, and its implications for Pfizer’s credit profile, in greater detail below.
Table 1: List of key drugs facing patent expiry
|
Name |
Indication |
US Patent Expiry |
US FY2025 Revenue |
Global FY2025 revenue |
% of FY2025 total revenue |
|
Eliquis |
Cardiovascular |
2028 |
USD$5.1b |
USD$8.0b |
12.8% |
|
Ibrance |
Oncology |
2027 |
USD$2.7b |
USD$4.1b |
6.5% |
|
Xtandi |
Oncology |
2027 |
USD$2.2b |
USD$2.2b |
3.5% |
|
Xeljanz |
Immunology |
2026 |
USD$0.63b |
USD$1.1b |
1.8% |
|
Data as of 31 December 2025 Source: Company data, iFAST compilations. |
|||||
Pipeline Reinforcement: Bridging the USD$17b revenue gap
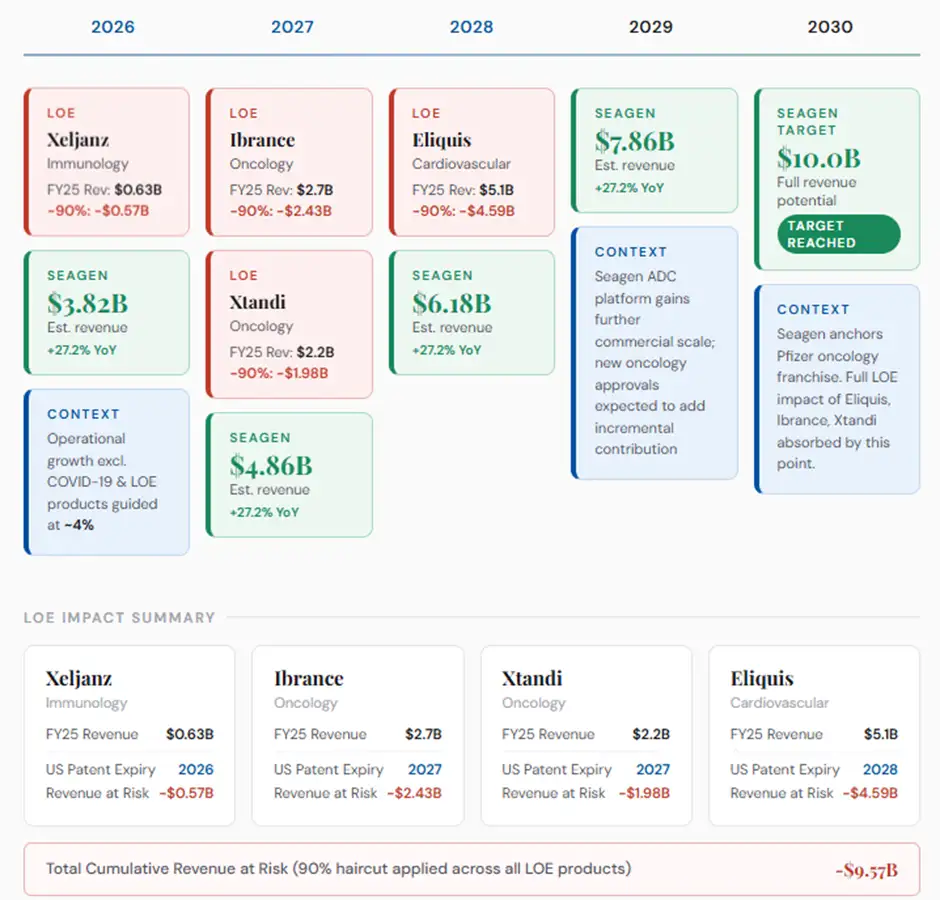
The transition narrative we allude to above is best understood through the lens of Pfizer’s loss of exclusivity (LOE) cycle–essentially, the patent expiry of its key drugs, which represents the most consequential near-term challenge facing Pfizer’s credit profile. Blockbuster products representing roughly USD$15.4b in annual revenue (do note that Pfizer’s CEO estimates USD$17b in net revenue to be lost owing to some additional smaller product exposure) are set to lose patent protection by 2030. For instance, Ibrance and Xtandi (Pfizer’s key oncology and prostate cancer franchises) contributed roughly 10% of FY2025 revenue and face patent expiry as early as 2027. More significantly, Eliquis, Pfizer’s single largest revenue driver (12.8% of FY2025 revenue) faces a US patent cliff in April 2028.
However, we highlight, that Pfizer is not entering this cycle unprepared. The USD$43b acquisition of Seagen in December 2023, is expected to contribute close to USD$10b in annual revenue by 2030. We note that the newly acquired oncology drugs, as part of this acquisition, are beginning to demonstrate tangible execution progress– Padcev, Adcetris, Tukysa and Tivdak have seen solid momentum in 2025. In particular, Padcev, recording a 15% market share, demonstrated strong growth, achieving roughly USD$1.9b in revenue for 2025, up 22% year on year (YoY). With patent protection through 2036, Padcev offers a meaningful and long-dated replacement revenue stream. In our view, Pfizer is not simply managing a patent cliff; the group is actively replacing expiring cash flows with high growth, longer-duration assets.
Diagram: Timeline of LOE + new drugs coming online (full revenue potential)
Expense discipline: Trimming the sails to navigate the cliff
While the pipeline build-out addresses the revenue side of the equation, we note that management is simultaneously executing a disciplined cost-alignment programme to protect operating margins through the LOE cycle. With USD$4.5b in net cost savings already achieved as of end FY2025, and Pfizer affirming the programme remains on track to achieve a cumulative USD$5.7b by end 2026, bondholders can be assured that management is actively managing the impact on bottom line due to the LOE for its key blockbuster drugs.
The primary lever is an optimisation of the manufacturing process, which involves the consolidation of global production sites and targeted headcount reductions in high-cost regions. Most notably, we note the significant headcount reduction in Switzerland, from approximately 300 employees to around 70 as of end 2025. We highlight that these efficiency measures are specifically pursued to neutralise the approximate USD$1.5b revenue headwind anticipated in 2026 from near-term LOE products. The result is a structurally leaner cost base that preserves the full capacity of Pfizer’s USD$11b annual R&D programme, a critical requirement for the refreshing of the group’s pipeline, without placing incremental pressure on the balance sheet.
As bondholders, we welcome management’s initiative to protect the bottom line as the group executes its pipeline replacement, which will in time, bolster the group’s debt servicing capacity.
Diversified Market Leadership: Building a multi-decade cash flow floor
Underpinning the pipeline replacement and cost optimisation initiatives pursued by Pfizer, is what we view as the credit anchor for the group: a diversified portfolio of long-duration patent protected assets that provide a durable cash flow floor for bondholders. We highlight the Vyndaqel/Vyndamax franchise (see table 2 below for a list of blockbuster drugs with longer tenor patents), where ahead of Vyndaqel’s 2026 basic patent expiry, Pfizer has successfully transitioned most patients to Vyndamax, which holds US patent protection through 2035. This effectively extends the revenue life (10.2% of FY2025 revenue) of the franchise by nearly a decade. Similarly, the Prevnar 20 vaccine is shielded by a layered patent structure extending as far as 2039 (Note: 2039 is the estimated year where generics come online compared to the 2035 patent expiry disclosed by Pfizer), anchoring a multi-billion-dollar revenue stream well into the next decade.
We note that these long-duration assets contribute meaningfully to Pfizer’s USD$11.7b in OCF in FY2025 and we think their collective durability provides creditors with a strong cash flow floor as the Eliquis patent cliff of April 2028 draws near. While this diversified asset base does not eliminate patent cliff risk, it should meaningfully support the group’s debt-servicing capacity, something that supports the group’s credit profile.
Table 2: Selected list of drugs with longer patent protections
|
Name |
Indication |
US Patent Expiry |
US FY2025 Revenue |
Global FY2025 Revenue |
Global % of FY2025 Revenue |
|
Vyndaqel / Vyndamax |
Cardiology |
2035 |
USD$3.8b |
USD$6.4b |
10.2% |
|
Prevnar Family |
Vaccines (Bacterial) |
2035 |
USD$4.2b |
USD$6.5b |
10.4% |
|
Comirnaty* |
Vaccines (Viral) |
2041 |
USD$1.7b |
USD$4.4b |
7.0% |
|
Paxlovid* |
Anti-infectives (Viral) |
2041 |
USD$1.9b |
USD$2.4b |
3.8% |
|
Nurtec ODT/Vydura |
Neuroscience (Migraine) |
2034 |
USD$1.3b |
USD$1.4b |
2.2% |
|
Abrysvo |
Vaccines (RSV) |
2036 |
USD$0.54b |
USD$1.0b |
1.6% |
|
Lorbrena |
Oncology |
2033 |
USD$0.41b |
USD$1.0b |
1.6% |
|
*: Drugs related to COVID; management guided that
US$5b should be the revenue floor moving forward Source: Company data, iFAST compilations. |
|||||
Decent Credit Profile
Overall, Pfizer retains a solid credit profile, anchored by the long-duration cash flows generated by its diversified portfolio of therapeutics, protected by long patent protections.
As of 31 December 2025, the group carries USD$13.6b in cash and equivalents on its balance sheet, with a further USD$7.2 billion in undrawn credit facility, giving the group a total available liquidity of roughly USD$20.8 billion. Pfizer carries a total debt on hand of USD$64.8b, of which USD$3.0b comes due within the next year. Looking ahead (see chart 1 below), we find that most of the group’s debt (65%) matures in 2031 and beyond. Hence, we see little risk in Pfizer meeting its near-term obligations, while its ability to meet its longer-dated obligations will be dependent on the group’s ability to sufficient replenish its pipeline of drugs. Given the good progress shown thus far, we believe there’s a fair chance that Pfizer would be able to sufficiently replace its LOE drugs. Do note our analysis does not account for the possible success of Pfizer’s internally developed drugs, which could potentially add incremental billions in revenues and cashflows should they pass clinical trials, and we are not accounting for new M&A.
The group’s liquidity is supplemented by strong cash generation, both OCF and FCF, as highlighted in chart 2 below. Discounting the spikes due to COVID, we are comfortable with the group’s ability to generate roughly USD9+b in free cash flow, which more than covers its annual interest of ~USD$2b.
As seen in table 3 below, the group’s leverage metrics have softened from FY2024. Net Debt / Equity rose from 49.7% in FY2024 to 59.2% in FY2025, while Net Debt / EBITDA increased from 2.4x to 3.1x in the same period. Meanwhile, interest coverage ratio (EBITDA / Gross interest expense) improved from 5.9x in FY2024 to 6.3x in FY2025 due to lower interest expense of USD$2.7b for 2025 (FY2024: USD$3.1b). Overall, we are comfortable with Pfizer’s credit metrics, especially given management’s recent guidance towards a more disciplined period of integration and deleveraging instead of aggressively pursuing M&A.
Chart 1: Pfizer’s upcoming obligations (till 2030), are comfortably covered by its liquidity
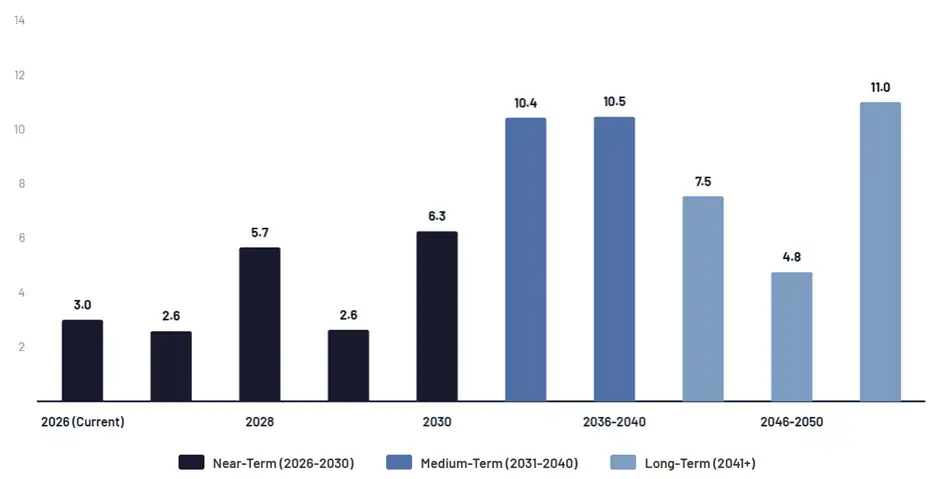
Chart 2: Consistent positive cash generation
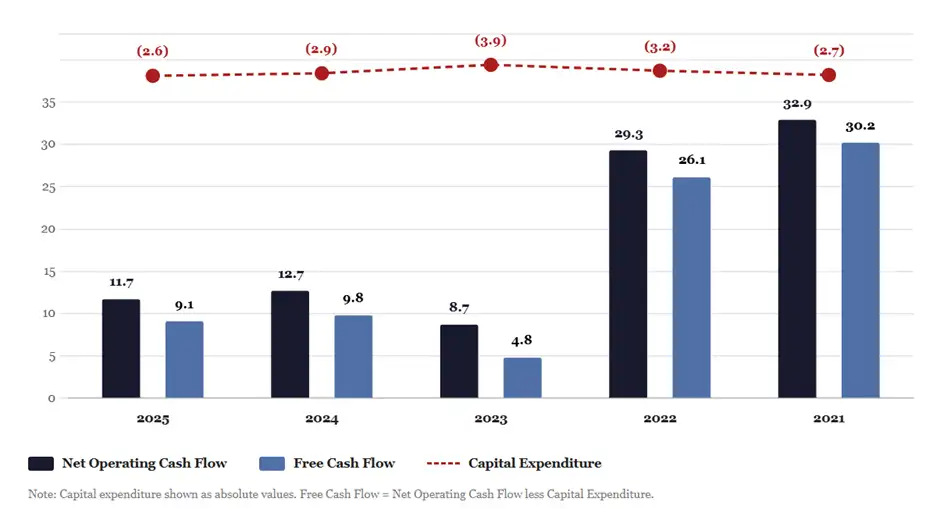
Table 3: Key Credit Metrics
|
Credit Metrics |
FY2021* |
FY2022* |
FY2023 |
FY2024 |
FY2025 |
|
Net Debt / Equity |
9.5% |
13.7% |
66.5% |
49.7% |
59.2% |
|
Net Debt / EBITDA |
0.2x |
0.3x |
6.2x |
2.4x |
3.1x |
|
Interest Coverage Ratio (EBITDA / Gross Interest Expense |
23.5x |
33.1x |
4.3x |
5.9x |
6.3x |
|
*: FY2021 – FY2022 were the peak years of over-earning due to COVID Data as of 31 December 2025 Source: Company data, iFAST estimates, iFAST compilations. |
|||||
Table 4: About the Bonds
|
Issue |
Issuer |
Ask Price |
Yield to Worst (%) |
Years to Maturity |
Credit Rating (S&P / Fitch / Moody’s) |
|
Pfizer Investment Enterprises Pte Ltd |
100.04 |
4.74% |
7.1y |
A / - / A2 |
|
|
Pfizer Investment Enterprises Pte Ltd |
93.70 |
5.76% |
27.1y |
A / - / A2 |
|
|
MRK 4.500% 17May2033 Corp (USD) |
Merck & Co Inc |
100.12 |
4.48% |
7.1y |
A+ / - / Aa3 |
|
Merck & Co Inc |
90.62 |
5.68% |
27.1y |
A+ / - / Aa3 |
|
|
BMY 5.900% 15Nov2033 Corp (USD) |
Bristol Myers Squibb |
107.74 |
4.64% |
7.6y |
A / - / A2 |
|
BMY 6.250% 15Nov2053 Corp (USD) |
Bristol Myers Squibb |
106.60 |
5.75% |
27.6y |
A / - / A2 |
|
ABBV 4.400% 15Mar2033 Corp (USD) |
Abbvie Inc |
98.80 |
4.60% |
6.9y |
A- / - / A2 |
|
ABBV 5.400% 15Mar2054 Corp (USD) |
Abbvie Inc |
95.96 |
5.69% |
27.9y |
A- / - / A2 |
|
LLY 4.700% 27Feb2033 Corp (USD) |
Eli Lilly & Co |
101.30 |
4.47% |
6.9y |
A+ / - / Aa3 |
|
Eli Lilly & Co |
89.98 |
5.60% |
26.9y |
A+ / - / Aa3 |
|
|
Source: Bloomberg, Bondsupermart. iFAST Compilations. Data as of 17 April 2026 |
|||||
In sum, we think Pfizer’s credit profile is decent, backed by its portfolio of long-duration therapeutics, protected by long patent expiries. While the group’s upcoming patent cliff presents a credible threat to its credit profile, we believe that the integration of Seagen should help mitigate the full brunt of it. We note that in our analysis, we did not ascribe any value to Pfizer’s internally developed therapeutics, which should they prove successful, would add billions in revenues and earnings, strengthening the group’s credit profile. Furthermore, management’s recent pivot, away from aggressive M&A, towards disciplined integration and deleveraging, also provides scope for improvement for the group’s credit profile. Overall, we believe Pfizer’s credit profile should stabilise moving forward.
In Table 4 above, we compare Pfizer’s outstanding 2032 and 2053 bonds against its peers of global pharmaceutical companies. In general, Pfizer’s bonds are fairly priced compared to its peers. Against sovereigns of comparable tenors, we note that these issues provide a spread of roughly 60 and 80 bps for the 2033 and 2053 tenors, respectively. Investors can consider the 2032 bond as an alternative to comparable sovereign securities given the safety profile of the issue and issuer (Pfizer is rated A and A2 by S&P Global and Moody’s).
Investors in Pfizer’s long-tenor 2053 bonds should note that this extended duration could face steep price declines if interest rates rise further, a headwind that credit strength cannot fully mitigate.
Declaration: For specific disclosure, at the time of publication of this report, IFPL (via its connected and associated entities) holds a position in PFE 5.300% 19May2053 Corp (USD), and the analyst who produced this report holds NIL positions in the abovementioned securities. This research report was prepared with the assistance of artificial intelligence (AI) tools. iFAST Financial Pte Ltd does not rely exclusively on AI for content generation; the content of this report – including all investment theses, ratings, price targets and conclusions – has been independently reviewed and verified by the research analyst(s) to ensure accuracy and professional integrity.