Highlights:
- High-yield bonds currently offer yields of 5–8%, about 200–360 basis points above investment-grade bonds, providing investors with attractive absolute returns. As central banks begin cutting rates in 2026 and risk-free yields move lower, the extra income from high yield will become more pronounced, making it a compelling option for those seeking steady coupon income.
- That said, valuations are no longer cheap. Spreads across markets are well below historical averages, and with levels approaching the tighter range seen in non-recessionary periods, future widening is possible given tariff pressures and slower growth. Investors should therefore be selective in choosing sectors and issuers.
- In a rate-cutting cycle, high-yield bonds still offer both coupon income and capital appreciation potential. We particularly favour short- to medium-term maturities, which provide attractive yields, shorter duration, and lower sensitivity to interest rate changes.
Although the spread premium of high-yield bonds over investment-grade debt is now at historical lows, overall credit spreads remain tight, limiting relative attractiveness. However, as the Federal Reserve continues to cut rates, high-yield bonds—offering absolute yields of 5–8%—will stand out more clearly as the rate-cutting cycle unfolds. This article outlines our outlook for the high-yield bond market in 2026 and highlights key investment opportunities.
High yield offers compelling absolute returns, with rate cuts amplifying the extra income
In today’s high-rate environment, yields across both investment-grade and high-yield bonds remain well above their 10-year averages. The exception is Asian high yield, where the property sector crisis in recent years pushed yields sharply higher, distorting the historical average above current levels (see Chart 1).
Chart 1: Yields across IG and HY bond categories
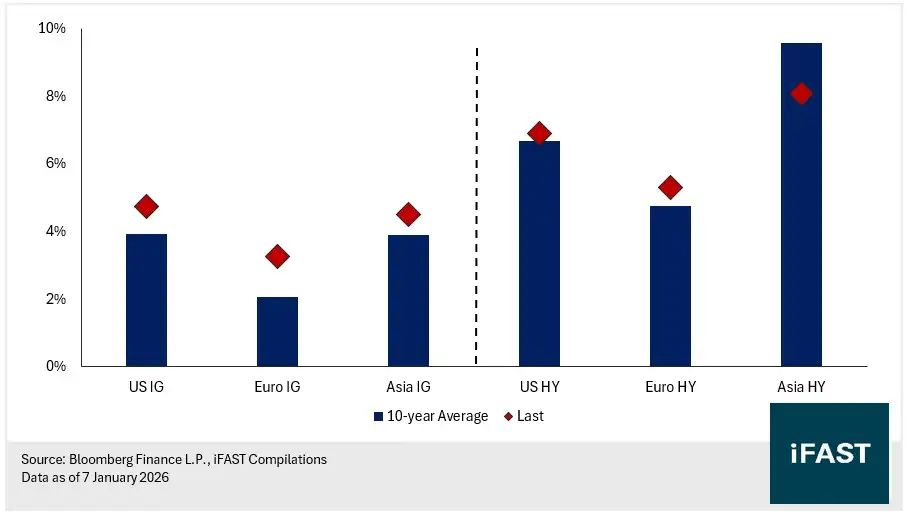
High‑yield bonds currently offer yields of 5–8%, about 200–360 basis points above investment‑grade bonds, providing investors with compelling absolute returns. As central banks begin cutting rates in 2026 and risk‑free yields move lower, the extra income from high yield will become more pronounced, making it a strong option for those seeking steady coupon income. Higher absolute yields also help cushion against risks of widening credit spreads or rising government bond yields.
Issuer Fundamentals Remain Resilient
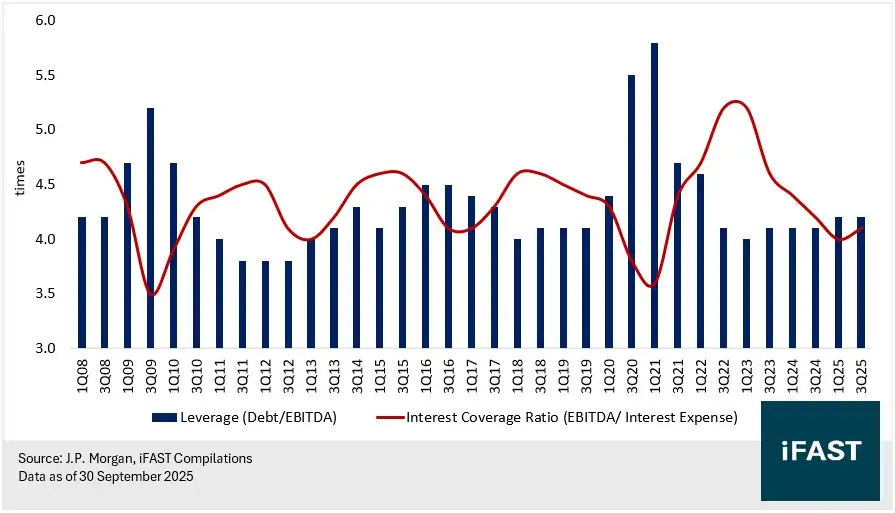
From a fundamentals perspective, high‑yield issuers’ balance sheets remain resilient. While total debt/EBITDA rose in 2025 due to increased borrowing, leverage ratios remain manageable. Interest coverage has stayed broadly stable (see Chart 2), and remained at relatively low levels.
Chart 2: HY issuer’s leverage and interest coverage ratio
 Meanwhile, the credit rating upgrade‑to‑downgrade ratio has declined in recent years but remains balanced at around 1.0 (see Chart 3).
Chart 3: HY issuer’s credit rating movement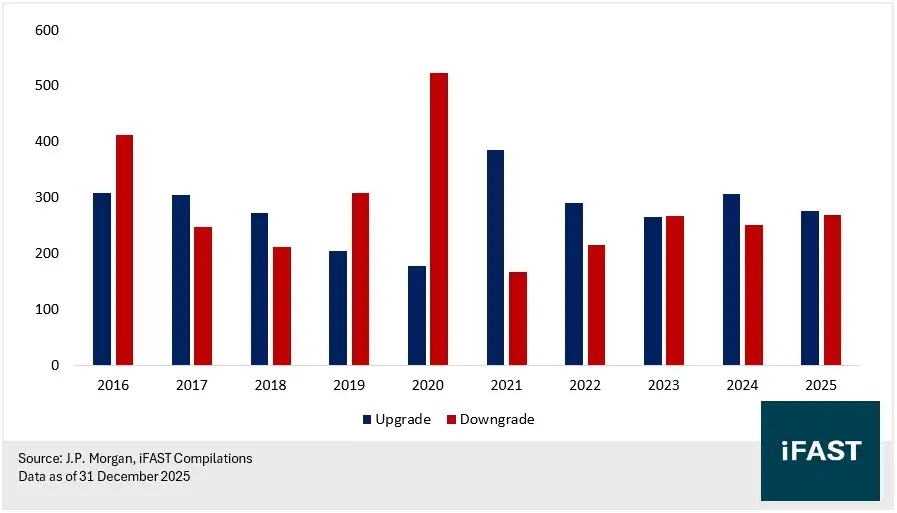 Overall, high-yield issuers have not shown significant deterioration across credit metrics. Although corporate earnings have been affected by tariffs and slower economic growth, the issuer default rate reached 4.4% in October 2025 (see Chart 4). Further analysis of 2025 default cases indicates that the affected companies were mainly concentrated in tariff‑sensitive sectors, including retail, food & beverage, and autos.
Chart 4: Credit Market Default Rate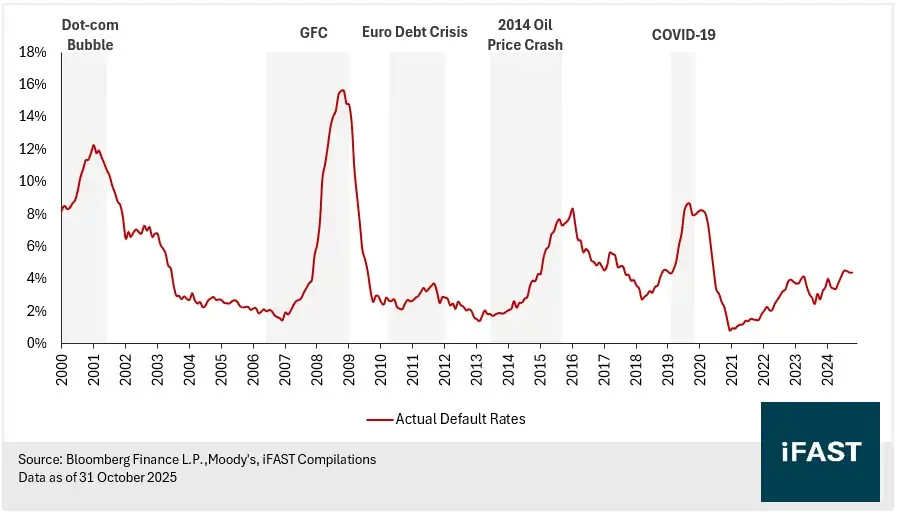 Looking ahead, tariffs and slower economic growth may pressure corporate earnings and cash flows, meaning fundamentals may not continue to improve. However, with rate cuts, fiscal support, and strong demand for new issuance creating a favourable refinancing environment, overall credit quality is expected to remain within manageable levels.
Spreads at Historically Tight Levels, Downside Risks Outweigh Upside Potential
That said, high‑yield bonds are no longer cheap. Across the US, Europe, and Asia, credit spreads have narrowed well below their 10‑year averages, with US high yield at roughly –1.1 standard deviations, Europe at –1.0, and Asia near –2.5 (see Chart 5).
Chart 5: High Yield Bond Credit Spreads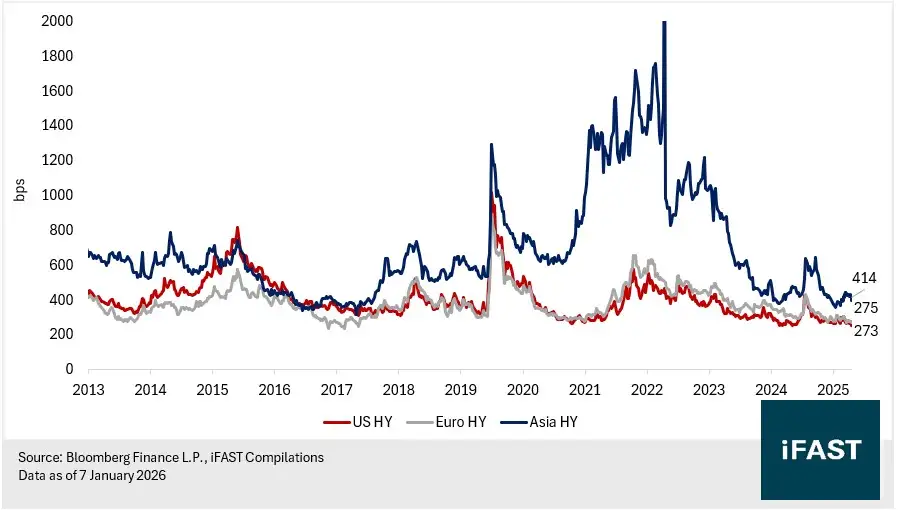
With limited catalysts, further spread tightening appears unlikely, while markets have become more sensitive to negative headlines. In other words, valuations now sit in a zone where downside risks outweigh upside potential.
As tariff costs feed into corporate earnings and economic growth slows, default rates and downgrade risks may rebound from recent lows. Given spreads are already near the tight levels seen in non‑recessionary periods, widening is more probable going forward. We therefore believe investors should focus on risk management and be selective in choosing sectors and issuers.
High‑Yield Allocation: Favour Asia Over US and Europe
1) Asian High Yield: “Quality Upgrade” After Market Cleansing
We prefer Asian high‑yield bonds in portfolio allocation. Although current yields are below historical averages, they remain attractive at 8.1%, compared with only 5.3% in Europe and 6.9% in the US.
Since the onset of China’s property crisis in 2022, the Asian high‑yield market has undergone a deep cleansing. Highly leveraged and riskier issuers have exited, leaving a healthier and more diversified issuer base. The market once had as much as 55% exposure to mainland China, but by the first half of 2025 this had fallen to 19%. In its place, exposure to Macau and India has increased, with new issuers from Japan and Australia further diversifying the landscape. As a result, geographic concentration risk has declined significantly (see Chart 6).
Chart 6: Regional Distribution of Asian High‑Yield Bond Index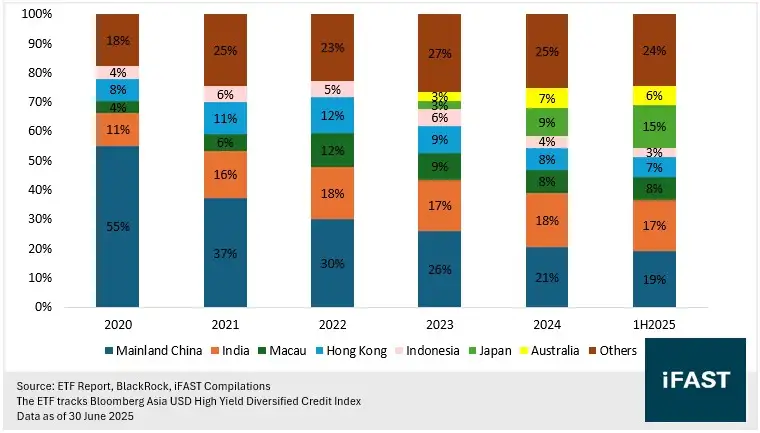
At the same time, the sector composition of Asian high‑yield bonds has become more diversified. Industrial issuers once accounted for as much as 64% of the market, but this has now fallen to 47%, with greater representation from financials, government‑related entities, and utilities. Excluding the property sector, Asia’s overall default rate is lower than that of the US, Latin America, and EMEA, underscoring the stronger and healthier issuer base in the region.
Although spreads have narrowed significantly since the property crisis, current yield levels in Asia remain higher than those in US and European high‑yield markets, offering attractive absolute returns. With improving corporate fundamentals, there is still room for further credit enhancement, making Asian high yield a compelling allocation choice for investors.
2) US and European High Yield: Stable on the Surface, Hidden Risks Beneath
Credit spreads in US and European high‑yield markets remain historically tight. Recent defaults in sectors such as autos and consumer finance highlight how weaker companies are coming under pressure in an environment of high interest rates and tighter bank lending standards.
For example, auto parts supplier First Brands Group filed for bankruptcy in October 2025. Its aggressive leveraged buyout strategy, financed through syndicated loans and private credit, combined with rising raw material costs and slowing auto demand, ultimately strained liquidity—underscoring the risks of rapid private credit expansion. Another case is Tricolor Auto Group, a subprime auto lender that filed for bankruptcy in September 2025 amid USD 800 million in fraud allegations, including double‑pledging assets and falsifying records. Its collapse drew attention to the subprime auto lending sector, where 60‑day delinquencies rose to 6.7% in October 2025, the highest since the early 1990s, signaling growing systemic risk in certain industries.
While systemic risk has not yet materialized in US and European high yield, valuations remain tight and private credit has expanded rapidly, now exceeding USD 1.2 trillion (see Chart 7). Risk dispersion across sectors and issuers is intensifying. Many marginal borrowers have shifted to private credit, keeping public market defaults low, but underlying issues may be masked. If economic growth slows or tariff pressures intensify, hidden risks in private credit could spill over into high yield. As Jamie Dimon noted, “cockroaches are often a sign of more to come.” We therefore believe investors should focus on careful issuer selection rather than broad sector allocation in US and European high yield.
Chart 7: Private Credit Market Size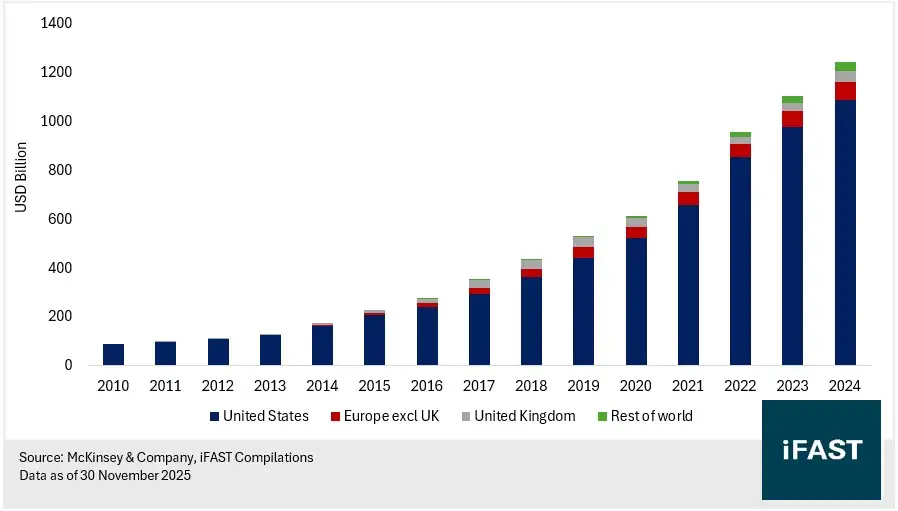
In terms of individual issuer selection, we prefer:
- Large issuers with stable cash flows and a domestic market focus, such as utilities and infrastructure;
- Avoid sectors highly exposed to tariffs and global trade risks, including autos and certain export‑oriented manufacturers.
Investment Implications: Selectivity Amid Tight Valuations
In summary, our 2026 high‑yield strategy can be framed as: “Attractive in a rate‑cutting cycle, but selective positioning is key to achieving better risk‑adjusted returns.” With spreads already tight, compensation for taking on additional credit risk is limited, and any negative economic or policy developments could trigger spread widening and price pressure. That said, high‑yield bonds still offer both coupon income and capital appreciation potential in a declining rate environment. We particularly favour short‑ to medium‑term maturities, which provide attractive yields, shorter duration, and lower sensitivity to interest rate changes.
We believe investors can consider short‑dated high‑yield bonds as an alternative to traditional short‑term instruments (such as T‑bills or money market funds), capturing significantly higher coupons than investment‑grade short bonds while avoiding elevated credit risk and long‑duration uncertainty.
From a market allocation perspective, we prefer Asian high‑yield bonds. Investors may consider our fund pick, “BEA Union Investment Asian Bond and Currency Fund (USD) A Acc”, to gain exposure. At the issuer level, we favour companies with strong balance sheets and improving credit fundamentals, with a preference for shorter maturities. Table 2 highlights selected high‑yield corporate bond opportunities across different sectors.
Table 2: Selected High Yield Corporate Bonds
| Bond | Issuer | Yield to Maturity/ Call | Years to Maturity/ Call | Bond Credit Rating (S&P/ Fitch) |
| MUTHIN 7.125% 14Feb2028 Corp (USD) | Muthoot Finance | 5.6% | 2.1 | BB+ / BB+ |
| MUTHIN 6.375% 23Apr2029 Corp (USD) | Muthoot Finance | 5.6% | 3.3 | BB+ / BB+ |
| RAKUTN 11.250% 15Feb2027 Corp (USD) | Rakuten Group | 4.7% | 1.1 | BB / - |
| RAKUTN 9.750% 15Apr2029 Corp (USD) | Rakuten Group | 5.6% | 3.3 | BB / - |
| HONGQI 7.050% 10Jan2028 Corp (USD) | China Hongqiao Group | 5.1% | 2.0 | - / BB+ |
| HONGQI 6.925% 29Nov2028 Corp (USD) | China Hongqiao Group | 5.4% | 2.9 | BB- / BB+ |
| TEVA 5.125% 09May2029 Corp (USD) | Teva Pharma Finance | 4.6% | 3.3 | BB / BB+ |
| TEVA 5.750% 01Dec2030 Corp (USD) | Teva Pharma Finance | 4.7% | 4.9 | BB / BB+ |
| BBVASM 5.125% 18Jan2033 Corp (USD) | BBVA Bancomer | 6.2% / 5.7% | 7.0 / 2.0 | BB / BB+ |
| SOCGEN 10.000% Perpetual Corp (USD) | Societe Generale SA | 8.4% / 5.6% | - / 2.9 | BB / BB+ |
| SOCGEN 9.375% Perpetual Corp (USD) | Societe Generale SA | 8.6% / 5.3% | - /1.8 | BB / BB+ |
| Source: Bondsupermart Data as of 16 January 2026 |
||||
Declaration: For specific disclosure, at the time of publication of this report, IFPL (via its connected and associated entities) holds MUTHIN 7.125% 14Feb2028 Corp (USD) and RAKUTN 11.250% 15Feb2027 Corp (USD), and the analyst who produced this report holds a NIL position in the abovementioned securities.