
According to McKinsey, investors have a new motivation to invest in private markets: exposure. Allocators and professional investors now believe that private markets have become effectively required for diversified participation in global growth.
Unlike hedge funds or unit trusts which typically invest in public market instruments such as stocks, private equity (“PE”) funds are pools of capital that focus on equity and debt instruments of private companies.
These pools of capital are managed by a fund manager, also known as a general partner of the PE fund. Broadly speaking, the general partner allocates capital to various investee companies with the objective of improving the operations or financial performance of the company, or even optimizing the firm’s capital structure. Value is created for the investor when the investee company’s EBITDA, valuation multiple or net debt position improves.
As seen in Table 1, PE funds have had a history and good track record of positive performance. Extracted from different SEC filings, Table 1 displays the performances of a few funds from four of the largest private equity groups as at 30 Sep 20.
The funds’ performances are indicated by their Net IRR, or net internal rate of return. These returns can be as high as 10% such as the example of the Fund VIII by Apollo Global Management, Inc. or 12% for the BCP VII by The Blackstone Group Inc.
Simply put, the Net IRR is a measure of what a PE fund investor earns, net of all fees and expenses. This performance measure also takes into account the time effect of fund inflows and outflows.
Table 1: Performance of selected PE funds from the biggest private equity firms
| Private equity firm | Fund name | Committed capital (USD m) | Total value (USD m) | Net IRR |
| Apollo Global Management, Inc. | Fund VII | 14,677 | 32,517 | 24% |
| Apollo Global Management, Inc. | Fund VIII | 18,377 | 24,553 | 10% |
| The Blackstone Group Inc. | BCP IV | 6,773 | 21,583 | 36% |
| The Blackstone Group Inc. | BCP VII | 18,809 | 22,831 | 12% |
| The Carlyle Group Inc. | CAP IV | 3,880 | 4,194 | 11% |
| The Carlyle Group Inc. | CETP III | 657 | 1,064 | 29% |
| KKR & Co. Inc. | Core Investment Vehicles | 9,900 | 8,852 | 19% |
| KKR & Co. Inc. | Asian Fund III | 9,000 | 8,215 | 24% |
| Source: SEC 10Q filings, iFAST compilations. As of 30 Sep 20. | ||||
However, private equity funds are not open to all individuals for subscriptions. In fact, PE funds usually raise capital from institutional investors who have substantial reserves of liquidity and a high ability to hold these investments for long periods of time.
PE bonds are now available to retail investors
Nonetheless, lawmakers have recently considered to open private equity to the broader group of investors. To expand the opportunity in private investment funds to US retail investors, the US Labor Department issued guidance to allow 401(k) savers to invest in funds with a private equity component last year. That guidance was written in “Information Letter 06-03-2020”, which effectively sets out the fiduciary, investment structure and regulatory requirements that fund managers must have before offering private equity to individuals.
In Singapore, retail investors have had the opportunity to invest in bonds backed by cash flows from private equity vehicles. With the ASTLC 3.850% 20Jun2029 Corp (SGD) - Class A-1 - Retail and ASTLC 4.350% 14Jun2028 Corp (SGD) - Class A-1 - Retail, investors may gain exposure to PE funds through these exchange listed bonds in board lot sizes of SGD 1,000.
Unlike corporate bonds, these PE bonds are asset backed securities that derive cash flows used to fund their interest and principal repayments from a pool of PE funds, which are paid according to a defined order of payment. Corporate bonds on the other hand, pay interest and principal from the issuer’s operating business or company’s cash reserve.
Our earlier articles on the Astrea PE bonds
We have written extensively on previous Astrea transactions. In “Your Ultimate Guide to Astrea V (Part 1)” and “Your Ultimate Guide to Astrea V (Part 2)”, we’ve introduced the Astrea V bonds, laid out the key points about the different collateralised fund obligations (“CFO”) and illustrated the results of analytical studies on Astrea V’s capacity to meet its financial commitments.
To find out more about CFOs, kindly refer to the article “The Astrea III Bonds Today” for a quick understanding on this unique form of securitization, as well as to read about the risks that are associated with the type of structured vehicle.
In “Astrea IV: What You Need to Know (Part 1)” and “Astrea IV: What You Need to Know (Part 2)”, we provided an overview of private equity, elaborated on the Azalea Group, the Astrea platform, the underlying holdings of the Astrea IV fund portfolios and the safeguard features of the bonds.
Structure of the Astrea V transaction at launch
Both structures of the Astrea IV and Astrea V transactions are nearly identical. In the example of Astrea V, the bonds are issued by Astrea V Pte. Ltd., a wholly owned subsidiary of Astrea Capital V Pte. Ltd, also known as the Sponsor (Figure 1a).
Astrea Capital V Pte. Ltd is the only shareholder of the issuer and a wholly own subsidiary of Azalea Asset Management Pte. Ltd. (Figure 1b). The latter is a Temasek Holdings subsidiary that focuses on the development and creation of new financial products. With the launch of the Astrea platform, Azalea Asset Management Pte. Ltd. has made private equity exposure available to retail investors in Singapore.
Figure 1a: An overview of the Astrea V transaction at launch
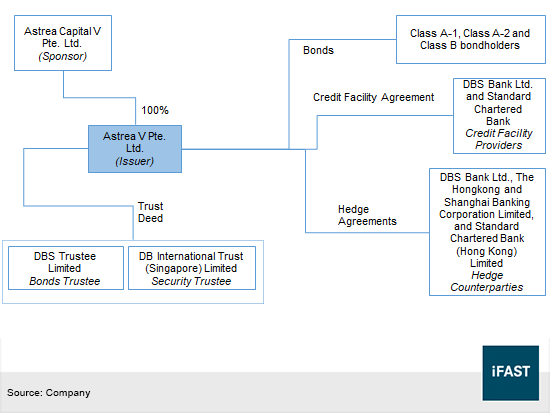
Figure 1b: An overview of the Astrea V transaction at launch
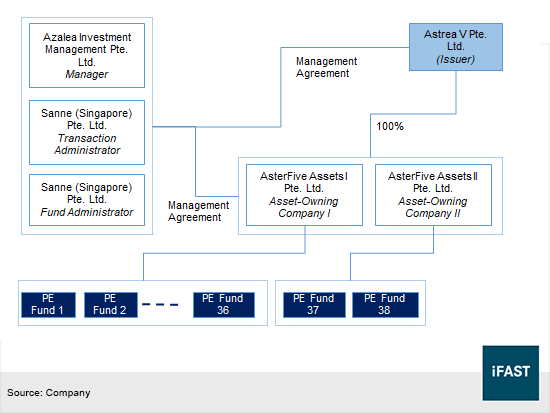
As exhibited in Figure 1a, one of the structural safeguards of the Astrea V transaction is a credit facility which may be used to fund expenses and capital calls in the event of funding shortfalls. At a maximum facility size of USD 300m, payments under the credit facility agreement may be used for unpaid commitment fees, accrued interest as well as the repayment of outstanding facility loans. However, the credit facility may not be used to repay bondholder principals.
According to Fitch Ratings, Astrea V Pte. Ltd. is effectively a bankruptcy remote company that owns two asset-owning companies – AsterFive Assets I Pte. Ltd. and AsterFive Assets II Pte. Ltd. The asset-owning companies receive payments from the underlying funds and directs them to the issuer, who will then pay interest to bondholders on a semi-annual basis.
How did the Astrea portfolios perform during the pandemic?
Overall, the Astrea portfolios have stood up against the virus outbreak and economic headwinds of 2020. The highly diversified nature of the portfolios helped to mitigate the drop in valuations in the non-performing sections of the portfolios.
In the private equity market, PE exit activities measured by Preqin dropped from USD 245 billion in the first half of 2019 (“1H19”) to USD 159 billion in 2H19, and plunged further to USD 110 billion during 1H20. However, a buoyant stock market and strong credit conditions provided a conducive environment for general partners to monetize their investments in the second half of 2020. As a result, PE exit activities rebounded to USD 337 billion in 2H20.
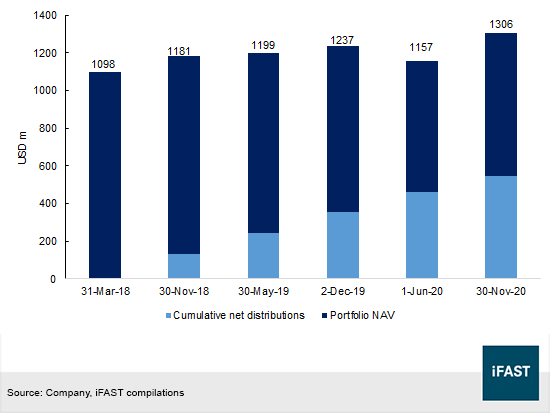
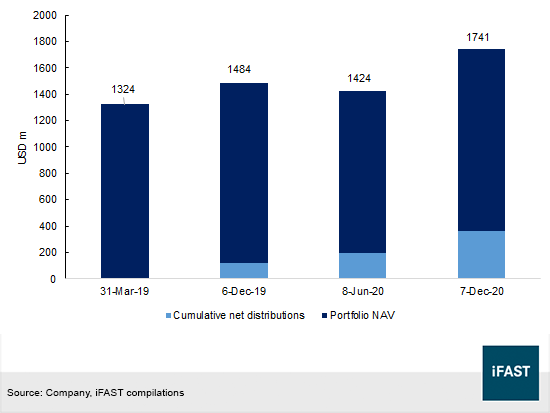
The drop and recovery market pattern was also seen in the 2020 performances for the Astrea IV and Astrea V portfolios. Total values – defined as the sum of the portfolio net asset value (“NAV”) and cumulative distributions are exhibited in Figures 2 and 3.
After recording consecutive gains in total returns since issuance in 2018 and following disclosures from the Astrea Investor Day 2021 presentation, the Astrea IV portfolio declined from USD 1,237m on 2 Dec 19 to USD 1,157m on 1 Jun 20. Valuations soon improved and the total return of the portfolio surpassed its pre-Covid level to reach USD 1,306m on 30 Nov 20.
During the fourth distribution period ending in June 2020, the portfolio NAV ended at USD 696m. According to the distribution waterfall, USD 40m was paid to the reserves accounts and this resulted in a net debt amount of USD 349m, thereby breaching the maximum loan-to-value (“LTV”) ratio of 50%.
To recap, the LTV test is a structural safeguard to protect bondholders as it helps to ensure that there is sufficient equity in the structure. Bondholders are protected from the risk of a decline in portfolio value as well as the risk of too much fund distributions exiting the structure. If the LTV ratio breaches the 50% trigger, it will have to reduce its leverage by diverting cash flows to the reserves accounts and, if necessary, redeem the bonds.
Due to the breach of the 50% LTV ratio, an additional USD 1m was paid from the net distributions to the reserves account during the fourth distribution period. Subsequently, the LTV ratio was lowered to below 50%.
At the same time, the Sponsor was entitled to the remaining distributions of USD 53m but decided instead to channel the amount to the reserves accounts. With the additional payment of USD 53m, the LTV ratio was further reduced to 42.4% as a consequence. This particular transaction demonstrated a strong alignment of interest between the Sponsor and the bondholders.
As of the fifth distribution period on 30 Nov 20, Astrea IV’s portfolio NAV ended at USD 762m. With USD 504m of bonds outstanding and a reserves accounts balance of USD 214m, the LTV ratio for the portfolio fell to 32.8%.
Figure 2: Astrea IV portfolio performance
Similar to Astrea IV, the Astrea V portfolio declined in the first half of 2020 but climbed to a record high in late 2020. The total return of the portfolio (i.e. the combined value of the Portfolio NAV and cumulative distributions) dropped to USD 1,424m in June 2020 from USD 1,484m in December 2019, but subsequently staged a strong recovery to USD 1,741m on 7 Dec 20.
In the second distribution period at the end of June 2020, the Astrea V structure received USD 76m of cash flows for the priority of payments. Although there was no breach in the LTV ratio, the Sponsor also waived its entitled distributions of USD 12m and channelled it to the reserves account. Accordingly, the LTV ratio was lowered to 40.6% from an initial 41.5%.
Figure 3: Astrea V portfolio performance
Bond performance
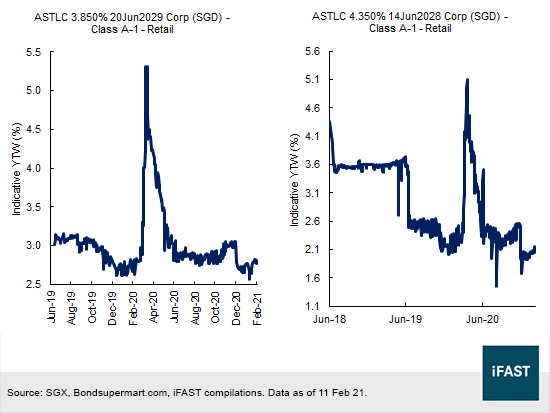
Indicative yields to worst (“YTW”) for the Astrea IV’s ASTLC 4.350% 14Jun2028 Corp (SGD) - Class A-1 - Retail traded around 2.11% at an ask price of 105.1 on 11 Feb 21, which represented a credit spread of approximately 180 basis points over the equivalent SGD swap offer rate (“I-spread”). Last year, yields on the notes soared to as high as 5.09% at the onset of the virus outbreak early in 2020 but fell to lower than 2% in December (Figure 4).
Figure 4: Historical YTWs of the retail Astrea IV and Astrea V bonds
The bond is first callable on 14 Jun 23. If it is not redeemed on the first call date, the coupon rate will be stepped up by 1%. A bonus redemption amount of 0.5% of the aggregate principal would be paid to bond holders if the Sponsor received a cumulative sum of USD 313m from the net underlying fund proceeds. At the current rate, the Sponsor may reach its USD 313m target in 2021 as the Sponsor has already received total distributions of USD 283m as at the fifth distribution date in November 2020.
Likewise, indicative yields to worst for the Astrea V’s ASTLC 3.850% 20Jun2029 Corp (SGD) - Class A-1 - Retail traded around 2.81%, or equivalently an I-spread of 240 basis points at an ask of 103.4 on 11 Feb 21. Coinciding with market volatility in the first quarter of 2020, bond yields spiked briefly to 5.31% in March (Figure 4) before recovering to current levels. With a 240 basis point I-spread and given the recent gains in the Astrea V’s portfolio valuation, we think that the retail bonds of the Astrea V transaction are more attractively priced than the ASTLC 4.35% 2028’s.
The entire tranche of the Class A-1 notes is first callable on 20 Jun 24. The issuer, Astrea V Pte Ltd may redeem the notes on two conditions - (i) the total balance in the Reserves Accounts and the Reserves Custody Account is sufficient to repay the aggregate principal amount of the bonds and (ii) no loan amount under the credit facility is left unpaid on the call date. A 0.5% bonus redemption amount will also be paid to bond holders if the Sponsor received a cumulative sum of USD 407m from the net underlying fund proceeds.
Figure 5: Relative valuation among ASTLC USD notes
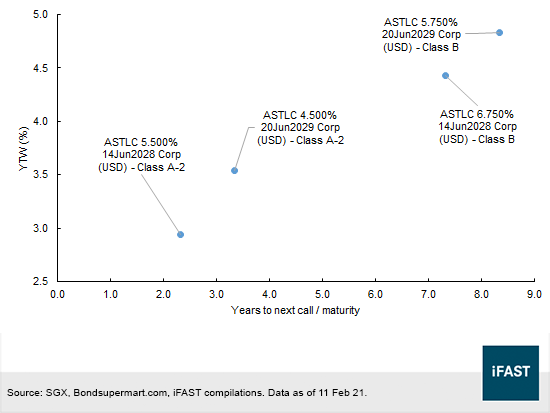
Comparing US dollar bond yields along the ASTLC curve, we think that the 3.54% YTW of the ASTLC 4.500% 20Jun2029 Corp (USD) - Class A-2 is comparatively more attractive than the ASTLC 6.750% 14Jun2028 Corp (USD) - Class B (YTW: 4.43%). We prefer the former given that the bonds have a 89 basis point yield pickup with a 4-year difference in tenor. Like the ASTLC 3.850% 20Jun2029 Corp (SGD) - Class A-1 - Retail, the ASTLC 4.5% 2029’s is callable on 20 Jun 24.
In summary, we like the Astrea PE bonds considering its well-diversified PE investment portfolio, structural credit safeguards to bondholders, and a strong alignment of interest between the Sponsor and noteholders. We believe that the Astrea IV and Astrea V retail notes offer an opportunity to gain exposure to private equity. Moreover, the bonds provide a viable option for investors to diversify their portfolio away from public markets.
Declaration: For specific disclosure, at the time of publication of this report, IFPL (via its connected and associated entities) and the analyst who produced this report hold a NIL position in the abovementioned securities.
Our podcast series, Yield Hunters, is available on Spotify, iTunes Podcasts and Google Podcasts.
In a time when bonds were (and still are) typically made available to institutional investors and HNW investors, Azalea Investment Management made headlines when they issued Astrea IV, the first ever Private Equity bond accessible to retail investors in Singapore.
In this episode, we speak with Lim Jun Jie, Associate Director at Azalea Investment Management to find out more about the Astrea bonds, how such private equity bonds work and how they can add value to our investment portfolios. Tune in below and follow us!