We are reiterating our buy call on the GGRSP 4.750% 25Jan2021 Corp (SGD), a SGD bond issued by Golden Assets International Investment Pte Ltd (“GGRSP”), a wholly-owned subsidiary of Golden Agri-Resources Ltd (“GAR”).
The operators of the Straits Times Index (“STI”) have removed GAR from the stock index, but we think that that company retains a decent credit profile. The market capitalization of the firm plummeted by nearly 10% during December, with the stock’s volatility likely caused by exchange-traded funds and index arbitrageurs, who are selling the company’s shares as part of their investment mandates to track the STI.
In the quarter ended September (“3Q19”), the group’s revenue dropped 15% to USD1.56 billion from a year ago as lower crude palm oil (“CPO”) prices weighed on its financial performance. Gross profit declined 32% YoY to USD188m while EBITDA — defined as earnings before interest, taxes, depreciation and amortization, fair value changes of biological assets, foreign exchange gains/losses, and exceptional items — dropped 19% to USD107m in the quarter.
Despite the drop in revenue and EBITDA, GAR’s swung from a net loss of USD53m in 3Q18 to a net profit of USD6m in 3Q19, on the back of a 34% drop in selling expenses and 5% decline in general and administrative expenses. In addition, foreign exchange gains and other operating income, which mainly comprised of fair value changes of biological assets, contributed to the positive bottom line for the third quarter.
Adequate liquidity
We believe GAR has sufficient liquidity to meet its short-term borrowings¸ although a sizable amount of its hard assets are non-current assets. As of end-September, the group held USD143m of cash and cash equivalents, USD370m of short-term investments, USD950m of inventories, and USD1.29 billion of long-term investments. As at end-2018, long-term investments were presumably made up of equity and fund investments, as well as a convertible debt security relating to a 3% secured loan to a third party maturing in October 2020.
Other assets that GAR could potentially monetize to repay debt include land rights and buildings that were valued at USD366m and USD859m respectively in 2018. Collectively, the ~USD 2.69 billion book value of the cash, short-term investments, inventory, land rights, and buildings should help the firm tide over its USD1.73 billion of short-term borrowings. The one caveat here is that it may take GAR a considerable amount of time to liquidate long-term assets, which could weigh on the company’s ability to meet near-term obligations and increase the bond price volatility.
As part of our investment thesis, we think that GAR is likely to receive support from affiliated entities within the Sinar Mas group of companies. The firm is associated with the broader Sinar Mas conglomerate with a 92% stake in PT Sinar Mas Agro Resources and Technology Tbk, a publicly listed entity on the Indonesia stock exchange. The Sinar Mas group was founded by the Widjaja family and operates a number of business units including Asia Pulp and Paper, Sinarmas Land and Sinarmas Financial Services. Mr. Franky Oesman Widjaja is the Chairman and Chief Executive Office of GAR, while the Widjaja Family Master Trust keeps a 50.35% interest in the company.
Besides, management has a track record of refinancing large amounts of short-term debt. Cash flows from the drawdowns and repayments of short-term borrowings were nearly equal to each other over the past few quarters, indicating a high refinancing ability. USD996m of GAR’s USD1.73 billion of short-term debt comprised of secured borrowings, and we think most of these may be rolled over. If the refinancing option fails, the palm oil producer should still be able to liquidate its inventory or equity investments to meet its short-term repayment obligations.
Golden Agri’s SGD bond and credit discussion
The GGRSP 4.750% 25Jan2021 Corp (SGD) is a senior unsecured debenture of Golden Assets International Investment Pte Ltd with a senior guarantee by Golden Agri-Resources. As defined in the offering circular, the terms of GAR’s medium term note program dictate that the ratio of the group’s total borrowings to its shareholder’s fund shall be less than 1.5 times.
Figure 1: The GGRSP 4.75% ‘21s are heading towards par
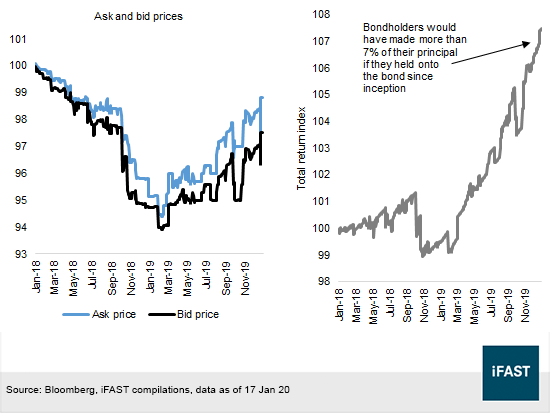
Bondholders who held the bond from its issuance till 16 Jan would have booked a total return (including unrealized loss) exceeding 7%. The bond’s price as shown in Figure 1 had been on an upward trend after bouncing off 95 in January 2019, coinciding with a modest improvement in GAR’s credit quality. Our assessment of its credit profile is based on our estimates of the firm’s credit metrics using information from its public filings, ranging from its interest coverage ratio, debt multiples and cash flows.
The company’s ability to service its debt displayed an overall improvement in 2019. The interest coverage ratio, determined by dividing the trailing-twelve-month (“TTM”) EBITA by financing charges, increased from 1.54x in 2018 to 1.62x in TTM 3Q19 (see Table 1).
As EBITA over interest expense grew, the group’s proportion of cash flows to total debt also continued to expand. Another indicator of its debt coverage capacity, the percentage of trailing net cash flows from operating activities (“CFO”) over total debt increased from 9% in 2018 to 14% in TTM 3Q19. This happened on the back of higher net cash inflows, mainly due to lower working capital requirements for downstream activities.
Our measure of financial leverage stems from the company’s ratio of total debt to total capital (debt plus shareholder’s equity), which also provides an understanding of its financial policy in the use of debt. We observed in Table 1 that leverage — the ratio of debt to total capital — declined from 44% in 2017 to 42% in 3Q19. When viewed differently as a multiple of its operating income, the debt-to-EBITDA multiple climbed to 6.10x from 4.84x in the same period. This was a result of lower EBITDA, affected mainly by softer palm oil prices and lower sales volume of oilseeds in China.
Table 1: GAR’s credit ratios
|
|
2017 |
2018 |
TTM 1Q19 |
TTM 2Q19 |
TTM 3Q19 |
|
TTM EBITDA (USD ‘000) |
664,651 |
572,975 |
572,480 |
532,973 |
507,599 |
|
Total debt over TTM EBITDA |
4.84x |
5.25x |
5.21x |
5.67x |
6.10x |
|
Total debt over total capital |
44% |
41% |
41% |
42% |
42% |
|
EBITA over interest expense |
1.84x |
1.54x |
1.63x |
1.47x |
1.62x |
|
Net CFO over total debt |
17% |
9% |
16% |
18% |
14% |
|
Source: Company, iFAST estimates |
|||||
Industry demand and price trends
For the full year of 2018, Golden Agri made USD 7.17 billion of revenue, most of which were linked to sales of palm kernel oil, crude palm oil (see Figure 2), refined bleached deodorized palm stearin (“RBD stearin”) and olein (“RBD olein”). Crude palm oil comes from the palm fruit, while palm kernel oil is extracted from the palm seed. Processed palm oil, or, RBD palm olein is mainly used as cooking oil and frying oil for the industrial production of processed foods. RBD palm stearin, another processed palm oil product, is largely used in the manufacturing of specialty fats and oleochemicals.
Figure 2: 2018 revenue breakdown by product type
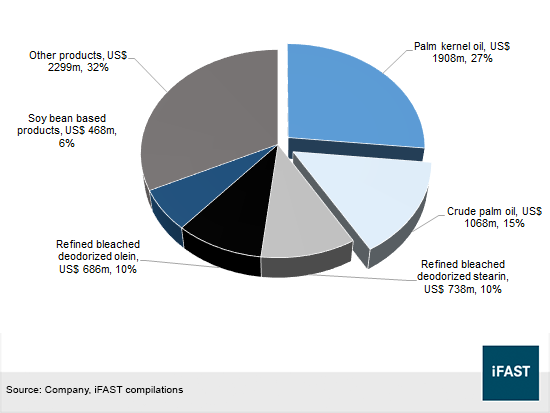
In terms of the geographical breakdown, China (12%), Indonesia (15%), India (22%), Europe (14%), and the rest of Asia (29%) accounted for most of the group’s product demand. In December, the European Union imposed tariffs of between 8% and 18% on Indonesian biodiesel for a 5-year period to counter alleged unfair subsidies from the government. Indonesia later retaliated by filing a World Trade Organization lawsuit against the EU over its plan to phase out palm oil-based biofuels.
While the EU tariffs will likely dampen biodiesel sales, we suspect that the tariff implementation will have a minimal impact on GAR as biodiesel products accounted for less than 5% of the group’s 2018 revenue. Furthermore, demand for biodiesel in Indonesia is expected to grow with the launch of the B30 biodiesel in January 2020, a fuel with a 30% bio-content.
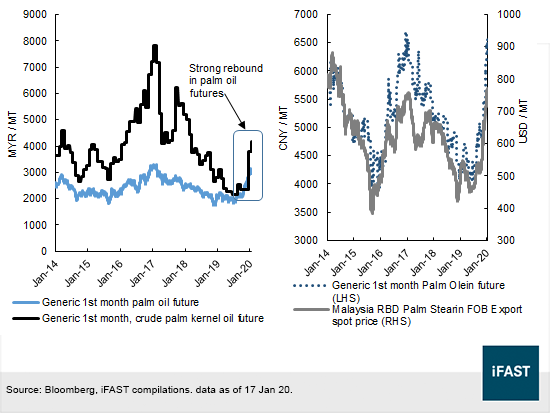
More importantly, the larger driver of revenue would be the price of palm oil and its derivatives, which have staged a strong upswing in 2019. Crude palm oil futures started the year between MYR 1,865 per metric ton (“MT”) and MYR 2,222/MT, but increased to as high as MYR 3,097/MT on 30 Dec 19. In a similar manner, benchmarks tracking the price of palm kernel oil, RBD stearin, and RBD olein gained 35%, 50%, and 60% respectively during 2019. Higher palm oil prices are credit positive for GAR as revenue from sales is recognized at a point in time according to the transaction price.
Figure 3: Crude palm oil futures and prices of its by-products
Vegetable oil substitutes
Vegetable oil market dynamics are a driver of the value of palm oil as price movements are affected by competing forces between palm oil and vegetable oil substitutes. Prices in general are likely to remain high ahead of the upcoming Lunar New Year as global inventory stays low. In the face of growing consumption, the aggregate stock level of vegetable oils declined from 22.11m MT in 2017/2018 to 19.58m MT in 2019/Jan 2020 (see Table 2).
Some vegetable oils are expected to see higher gains in prices than others. For
example, we think prices of rapeseed oil, soybean oil, and (to a certain
extent) palm oil would continue to move higher in consideration of their
falling inventories. Stock levels of rapeseed oil (or canola oil) and soybean
oil have been declining since 2015/2016 and this could lead to some fundamental
support for its prices.
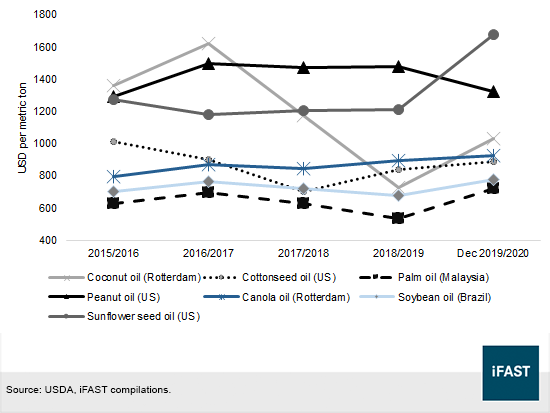
Demand for palm oil, being the cheapest vegetable oil in the market, is likely to continue to grow, while peanut oil may face some pricing headwinds in view of its elevated inventory level. Coconut oil, which is high in saturated fat, had seen a significant drop in prices as consumers started to question its health benefits. The wholesale price of coconut dropped from more than USD 1,600/MT in 2016/2017 to a more recent level of USD 1,032/MT.
Table 2: Inventories of major vegetable oils tracked by USDA
|
|
2015/2016 |
2016/2017 |
2017/2018 |
2018/2019 |
2019/ Jan 2020 |
|
Vegetable oil substitutes |
|||||
|
Coconut oil |
0.47 |
0.39 |
0.64 |
0.72 |
0.75 |
|
Cottonseed oil |
0.10 |
0.11 |
0.13 |
0.13 |
0.11 |
|
Olive oil |
0.53 |
0.34 |
0.61 |
0.56 |
0.59 |
|
Soybean oil |
3.75 |
3.76 |
3.48 |
3.59 |
3.34 |
|
Sunflower seed oil |
1.68 |
1.83 |
1.80 |
1.73 |
1.94 |
|
Peanut oil |
0.25 |
0.37 |
0.49 |
0.44 |
0.41 |
|
Rapeseed oil |
5.64 |
4.16 |
3.13 |
2.44 |
1.69 |
|
Palm oil and Palm oil kernel |
|||||
|
Palm oil |
8.16 |
8.89 |
11.00 |
10.98 |
9.93 |
|
Palm oil kernel |
0.68 |
0.70 |
0.83 |
0.85 |
0.84 |
|
Global |
21.27 |
20.55 |
22.11 |
21.44 |
19.58 |
|
Source: USDA, iFAST compilations. Figures in million metric tons unless indicated otherwise. Year begins 1 October. |
|||||
Figure 4: Average vegetable oil prices published by USDA
Competitors and peer evaluation
Golden Agri-Resources competes with other Southeast Asian palm oil producers, including Wilmar International Limited (“Wilmar”), Kuala Lumpur Kepong Bhd, and Sime Darby Plantation Bhd (see Table 3). Wilmar is one of the largest palm oil producers in the world with revenues in excess of USD 42 billion, or seven times larger than GAR. In line with lower palm oil prices, agricultural producers have witnessed declining revenue since 2017. The influence of palm oil prices is evident within the sector with the exception of Genting Plantations Bhd, which continued to grow its revenue in spite of sector headwinds.
Table 3: Competitor revenue
|
USD billion |
2014 |
2015 |
2016 |
2017 |
2018 |
TTM 3Q19 |
|
Genting Plantations Bhd |
0.50 |
0.35 |
0.36 |
0.42 |
0.47 |
0.51 |
|
First Resources Ltd |
0.62 |
0.45 |
0.58 |
0.65 |
0.63 |
0.58 |
|
Astra Agro Lestari Tbk PT |
1.38 |
0.98 |
1.06 |
1.29 |
1.34 |
1.23 |
|
IOI Corp Bhd |
3.67 |
3.35 |
2.85 |
1.69 |
1.82 |
1.76 |
|
Sime Darby Plantation Bhd |
2.99 |
2.90 |
3.64 |
3.29 |
2.95 |
|
|
Kuala Lumpur Kepong Bhd |
3.44 |
3.73 |
4.00 |
4.84 |
4.56 |
3.75 |
|
GAR |
7.62 |
6.51 |
7.21 |
7.51 |
7.17 |
6.38 |
|
Wilmar International Ltd |
43.08 |
38.78 |
41.40 |
43.57 |
44.50 |
42.49 |
|
Average palm oil price (MYR/MT) |
2,417 |
2,191 |
2,658 |
2,787 |
2,251 |
2,030 |
|
Source: Bloomberg estimates, iFAST compilations |
||||||
The recent rally in palm oil prices is a much needed boost to a sector that has been reeling from a slowdown in sales. The aggregate credit profile of the industry likely weakened together with lower revenue as net profit margins of most players dropped below 10%. As an illustration, the ratio of net income over revenue (“NI margin”) for Wilmar, the biggest company in the space, was less than 3% in TTM 3Q19, and not much higher than Sime Darby Plantations (0.9%).
The profitability of large palm oil producers such as GAR, Sime Darby, and Wilmar declined between 2017 and TTM 3Q19, possibly due to their high fixed cost structures. The debt-to-capital ratios of Wilmar and GAR were markedly higher than peers (see Table 4), while Sime Darby booked a current ratio of less than one, which is an indicator of a low financial liquidity.
Table 4: Recent financial performance of palm oil producers
|
|
NI margin (2017) |
NI margin (2018) |
NI margin (TTM 3Q19) |
Debt to total capital |
Current ratio |
|
Genting Plantations Bhd |
19% |
9% |
4.5% |
36% |
2.4 |
|
First Resources Ltd |
21% |
19% |
12.9% |
30% |
0.9 |
|
Astra Agro Lestari Tbk PT |
11% |
8% |
2.4% |
24% |
2.3 |
|
IOI Corp Bhd |
10% |
41% |
8.8% |
33% |
4.4 |
|
Sime Darby Plantation Bhd |
29% |
5% |
0.9% |
34% |
0.7 |
|
Kuala Lumpur Kepong Bhd |
5% |
4% |
4.0% |
37% |
2.8 |
|
GAR |
1.1% |
0.0% |
0.8% |
42% |
1.0 |
|
Wilmar International Ltd |
3% |
3% |
2.5% |
57% |
1.1 |
|
Source: Bloomberg, iFAST estimates |
|||||
GAR’s SGD bond still has upside potential
GAR has a long track record as a bond issuer. Since 2014, the group issued a total of nine bonds, eight of which have been redeemed (see Figure 5). During the five-year period between 2014 and 2019, PT Sinar Mas Agro Resources and Technology Tbk (“SMARIJ”), the group’s listed subsidiary, issued two IDR-denominated bonds at coupon rates of 9.00% and 9.25%.
The other bonds were priced at coupon rates between 4.08% and 5.50% in local currency terms, and total returns to bondholders ranged from 8% to 34% of the bond nominal amount. More specifically, the company’s ringgit-denominated 5.35% notes due 2019 was issued on 31 Jul 14 and was paid off in August 2019, giving bondholders who held the note since issuance a total return of 34% (assuming that coupons were reinvested at the prevailing benchmark rate).
Figure 5: Total returns of the GGRSP and SMARIJ bonds (in local currency terms)
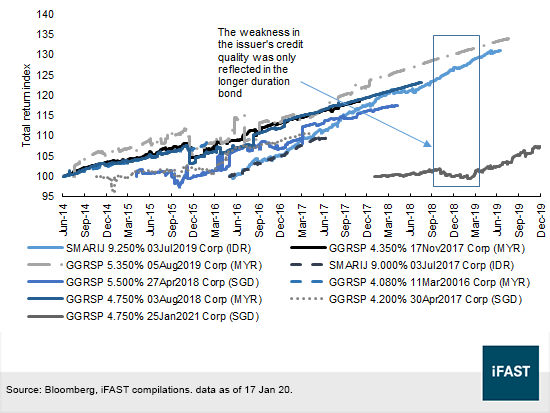
During 2018, the deterioration in GAR’s credit quality — marked by a decline in TTM EBITA over interest and net CFO over debt — was principally reflected in the bond prices of the longer tenor GGRSP 4.75% ’21s. At that time, prices of the GGRSP 4.75% ‘21s dropped to 95 but the GGRSP 5.35% ’19s (MYR) and SMARIJ 9.25% ‘19s (IDR) were left unscathed at close to 100.
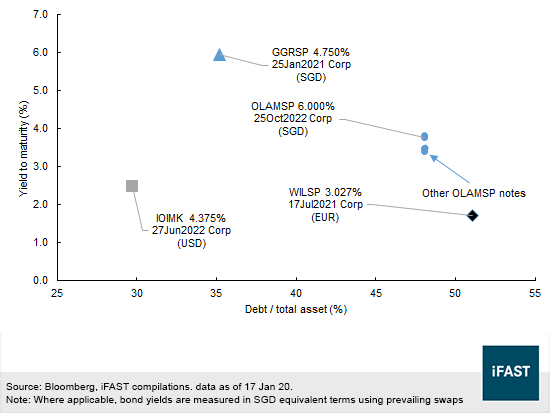
In determining the relative attractiveness of GAR’s SGD note to other bonds, we looked at the yields of existing issues across other palm oil producers, and included those of Olam International Limited due to a lack of perfect comparables. The bond yields were plotted against years to maturity in Figure 6. With a high ask yield to maturity of 5.96%, the GGRSP 4.750% 25Jan2021 Corp (SGD) is clearly an attractively priced credit among other bonds.
Figure 6: Relative valuation
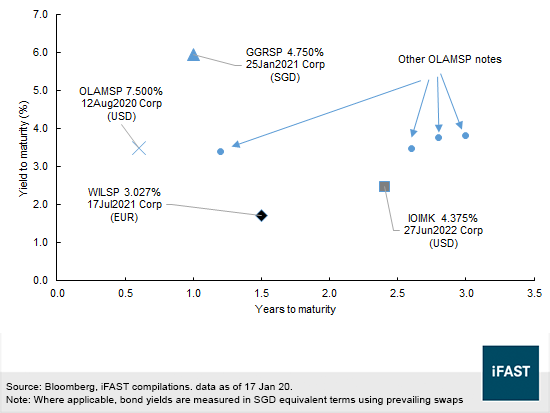
As a matter of fact, we think the market is ascribing a yield that is too punitive on the GGRSP 4.75% ‘21s. As a reference, Olam International Limited’s (3Q19 debt over asset: 48%) OLAMSP 6% ‘22s are yielding 3.76%. While we acknowledge that Olam has a significantly more diversified business and likely enjoys better access to capital markets due to its links to Temasek Holdings, we feel that the GGRSP 4.75% ‘21s offer good value at their spread of 453bps above SGD swaps.
On another note, when compared to the GGRSP 4.75% ‘21s, Wilmar’s 3.027% EUR notes due 2021 has a significantly lower yield on a post-swap basis (see Figure 7) even though Wilmar has a higher gearing (see Table 4). In the same way, the yields of IOI Investment (L) Bhd’s 4.375% USD notes due 2022 are considerably less attractive for their longer duration, although IOI Corporation Berhad (the guarantor) does have a stronger credit profile. To sum up, we would be inclined to recommend investing in the GGRSP 4.75% ‘21s over these two credits.
Figure 7: Relative valuation
All things considered, a sizeable amount of tangible assets and a long history of rolling over substantial short-term debt suggest that Golden Agri can handle its near-term refinancing needs, including paying off the 4.75% bond due 2021. The company is part of the Sinar Mas Group and may rely on some form of financial support from the conglomerate. Additionally, we do not think the liquidity profile of the firm is at risk even beyond a 12-month time frame as the group is likely able to sell its long-term assets to raise capital.
While it appears that the palm oil producer has low profit margins, increasing palm oil prices can lift its credit profile. A potential downside is a serious backlash against palm oil products for environmental reasons, but greater demand for palm-based biodiesel in Indonesia could offset the drop in demand from Europe.
Declaration:
For specific disclosure, at the time of publication of this report, IFPL (via its connected and associated entities) has a principal position in GGRSP 4.750% 25Jan2021 Corp (SGD). The analyst who produced this report holds a NIL position in the abovementioned securities.